Investor Education
How Equities Can Reduce Longevity Risk

Will You Outlive Your Savings?
The desire to live longer — and outrun death — is ingrained in the human spirit. The first emperor of China, Qin Shi Huang, may have even drank mercury in his quest for immortality.
Over time, advice for living longer has become more practical: eat well, get regular exercise, seek medical advice. However, as life expectancies increase, many individuals will struggle to save enough for their lengthy retirement years.
Today’s infographic comes from New York Life Investments, and it uncovers how holding a stronger equity weighting in your portfolio may help you save enough funds for your lifespan.
Longer Life Expectancies
Around the world, more people are living longer.
| Year | Life Expectancy at Birth, World |
|---|---|
| 1960 | 52.6 years |
| 1980 | 62.9 years |
| 2000 | 67.7 years |
| 2016 | 72.1 years |
Despite this, many people underestimate how long they’ll live. Why?
- They compare to older relatives.
Approximately 25% of variation in lifespan is a product of ancestry, but it’s not the only factor that matters. Gender, lifestyle, exercise, diet, and even socioeconomic status also have a large impact. Even more importantly, breakthroughs in healthcare and technology have contributed to longer life expectancies over the last century. - They refer to life expectancy at birth.
This is the most commonly quoted statistic. However, life expectancies rise as individuals age. This is because they have survived many potential causes of untimely death — including higher mortality risks often associated with childhood.
Longevity Risk
Amid the longer lifespans and inaccurate predictions, a problem is brewing.
Currently, 35% of U.S. households do not participate in any retirement savings plan. Among those who do, the median household only has $1,100 in its retirement account.
Enter longevity risk: many investors are facing the possibility that they will outlive their retirement savings.
So, what’s the solution? One strategy lies in the composition of an investor’s portfolio.
The Case for a Stronger Equity Weighting
One of the most important decisions an investor will make is their asset allocation.
As a guide, many individuals have referred to the “100-age” rule. For example, a 40-year-old would hold 60% in stocks while an 80-year-old would hold 20% in stocks.
As life expectancies rise and time horizons lengthen, a more aggressive portfolio has become increasingly important. Today, professionals suggest a rule closer to 110-age or 120-age.
There are many reasons why investors should consider holding a strong equity weighting.
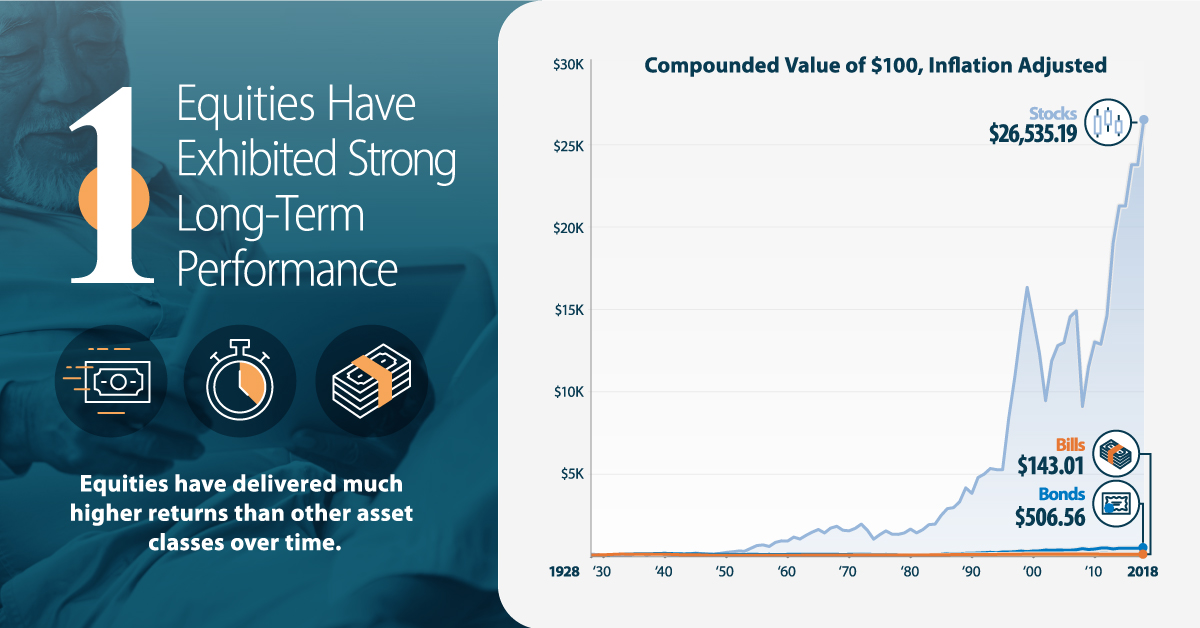
- Equities Have Strong Long-Term Performance
Equities deliver much higher returns than other asset classes over time. Not only do they outpace inflation by a wide margin, many also pay dividends that boost performance when reinvested.
- Small Yearly Withdrawals Limit Risk
Upon retirement, an investor usually withdraws only a small percentage of their portfolio each year. This limits the downside risk of equities, even in bear markets.
- Earning Potential Can Balance Portfolio Risk
Some healthy seniors are choosing to work in retirement to stay active. This means they have more earning potential, and are better equipped to recoup any losses their portfolio may experience.
- Time Horizons Extend Beyond Lifespan
Many individuals, particularly affluent investors, want to pass on their wealth to their loved ones upon their death. Given the longer time horizon, the portfolio is better equipped to ride out risk and maximize returns through equities.
Higher Risk, Higher Potential Reward
Holding equities can be an exercise in psychological discipline. An investor must be able to ride out the ups and downs in the stock market.
If they can, there’s a good chance they will be rewarded. By allocating more of their portfolio to equities, investors greatly increase the odds of retiring whenever they want — with funds that will last their entire lifetime.


Investor Education
How MSCI Builds Thematic Indexes: A Step-by-Step Guide
From developing an index objective to choosing relevant stocks, this graphic breaks down how MSCI builds thematic indexes using examples.


How MSCI Builds Thematic Indexes: A Step-by-Step Guide
Have you ever wondered how MSCI builds its thematic indexes?
To capture long-term, structural trends that could drive business performance in the future, the company follows a systematic approach. This graphic from MSCI breaks down each step in the process used to create its thematic indexes.
Step 1: Develop an Index Objective
MSCI first builds a broad statement of what the theme aims to capture based on extensive research and insights from industry experts.
Steps 2 and 3: List Sub-Themes, Generate Keyword List
Together with experts, MSCI creates a list of sub-themes or “seedwords” to identify aligned business activities.
The team then assembles a collection of suitable documents describing the theme. Natural language processing efficiently analyzes word frequency and relevance to generate a more detailed set of keywords contextually similar to the seedwords.
Step 4: Find Relevant Companies
By analyzing financial reports, MSCI picks companies relevant to the theme using two methods:
- Direct approach: Revenue from a company’s business segment is considered 100% relevant if the segment name matches a theme keyword. Standard Industrial Classification (SIC) codes from these directly-matched segments make up the eligible SIC code list used in the indirect approach.
- Indirect approach: If a segment name doesn’t match theme keywords, MSCI will:
- Analyze the density of theme keywords mentioned in the company’s description. A minimum of two unique keywords is required.
- The keyword density determines a “discount factor” to reflect lower certainty in theme alignment.
- Revenue from business segments with an eligible SIC code, regardless of how they are named, is scaled down by the discount factor.
The total percentage of revenue applicable to the theme from both approaches determines a company’s relevance score.
Step 5: Select the Stocks
Finally, MSCI narrows down the stocks that will be included:
- Global parent universe: The ACWI Investable Market Index (IMI) is the starting point for standard thematic indexes.
- Relevance filter: The universe is filtered for companies with a relevance score of at least 25%.
- False positive control: Eligible companies that are mapped to un-related GICS sub-industries are removed.
Companies with higher relevance scores and market caps have a higher weighting in the index, with the maximum weighting for any one issuer capped at 5%. The final selected stocks span various sectors.
MSCI Thematic Indexes: Regularly Updated and Rules-Based
Once an index is built, it is reviewed semi-annually and updated based on:
- Changes to the parent index
- Changes at individual companies
- Theme developments based on expert input
Theme keywords are reviewed yearly in May. Overall, MSCI’s thematic index construction process is objective, scalable, and flexible. The process can be customized based on the theme(s) you want to capture.
Learn more about MSCI’s thematic indexes.

-

 Investor Education6 months ago
The 20 Most Common Investing Mistakes, in One Chart
Here are the most common investing mistakes to avoid, from emotionally-driven investing to paying too much in fees.
-

 Stocks10 months ago
Visualizing BlackRock’s Top Equity Holdings
BlackRock is the world’s largest asset manager, with over $9 trillion in holdings. Here are the company’s top equity holdings.
-

 Investor Education11 months ago
10-Year Annualized Forecasts for Major Asset Classes
This infographic visualizes 10-year annualized forecasts for both equities and fixed income using data from Vanguard.
-

 Investor Education1 year ago
Visualizing 90 Years of Stock and Bond Portfolio Performance
How have investment returns for different portfolio allocations of stocks and bonds compared over the last 90 years?
-

 Debt2 years ago
Countries with the Highest Default Risk in 2022
In this infographic, we examine new data that ranks the top 25 countries by their default risk.
-

 Markets2 years ago
The Best Months for Stock Market Gains
This infographic analyzes over 30 years of stock market performance to identify the best and worst months for gains.


-

 Energy1 week ago
The World’s Biggest Nuclear Energy Producers
-

 Money2 weeks ago
Which States Have the Highest Minimum Wage in America?
-

 Technology2 weeks ago
Ranked: Semiconductor Companies by Industry Revenue Share
-

 Markets2 weeks ago
Ranked: The World’s Top Flight Routes, by Revenue
-

 Countries2 weeks ago
Population Projections: The World’s 6 Largest Countries in 2075
-

 Markets2 weeks ago
The Top 10 States by Real GDP Growth in 2023
-

 Demographics2 weeks ago
The Smallest Gender Wage Gaps in OECD Countries
-

 United States2 weeks ago
Where U.S. Inflation Hit the Hardest in March 2024