Markets
Animation: Mapping the Recovery from the Global Recession of 2020
How to Use: The below maps will animate automatically. To pause, move your cursor on the image. Arrows on left/right navigate.

Animated gif version, All three maps (Static)


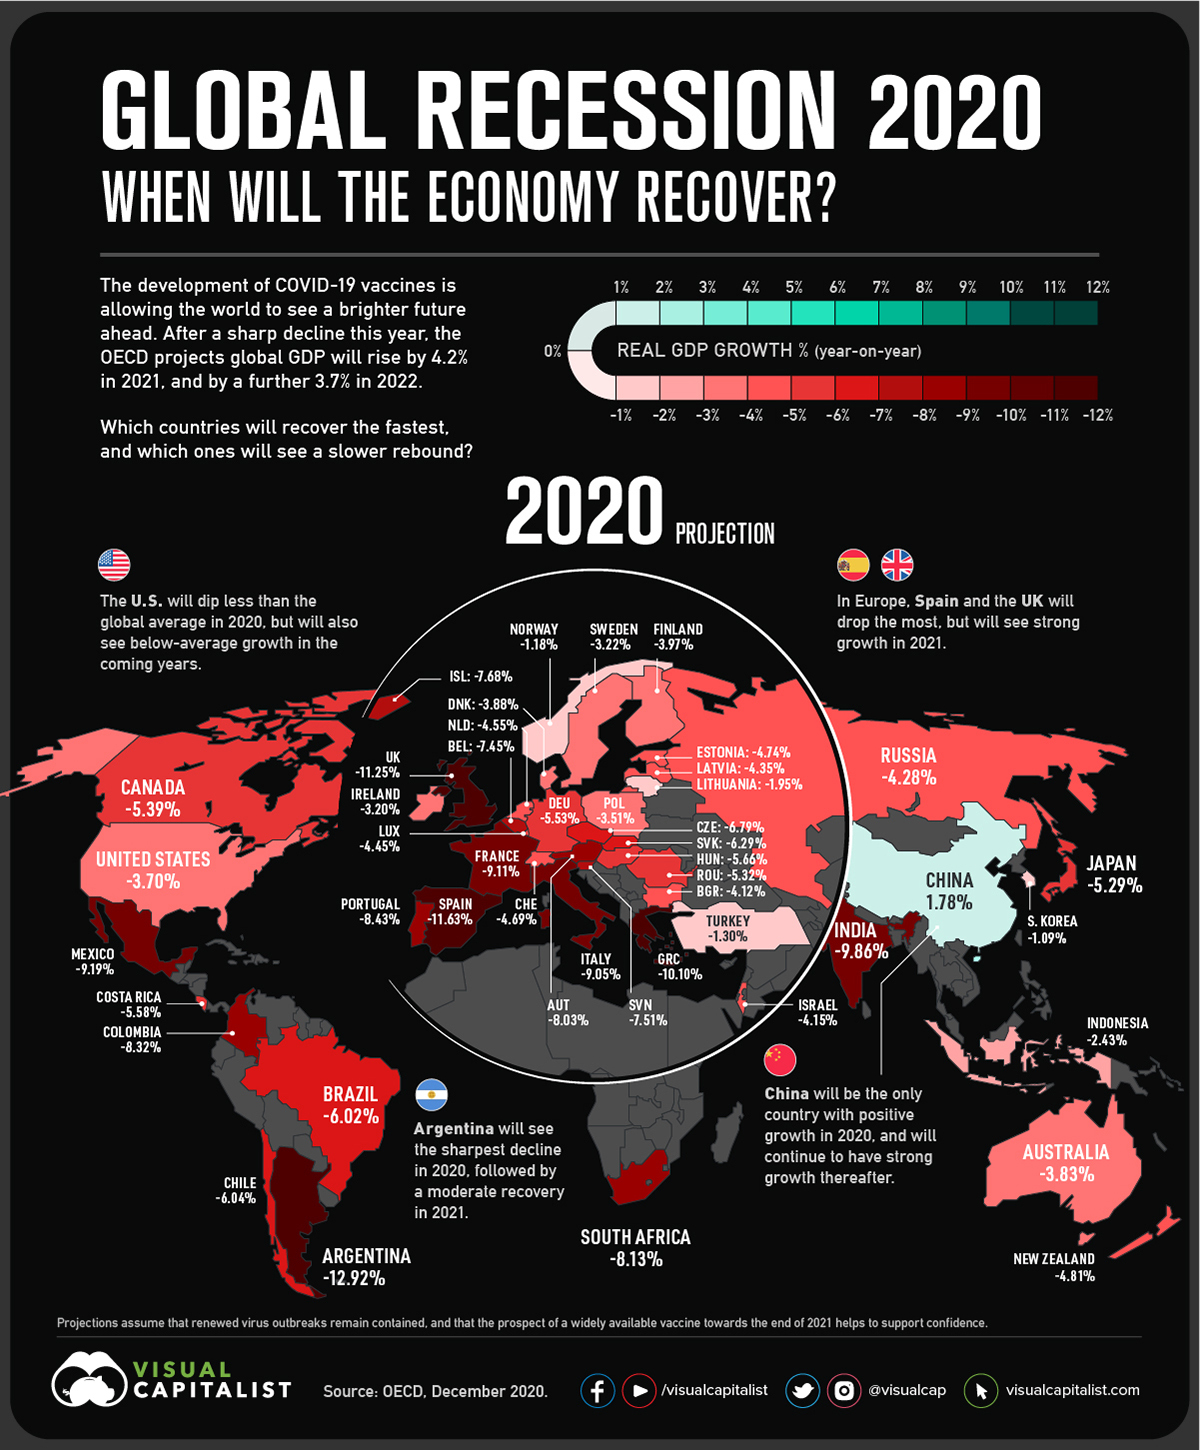
Global Recession 2020: When Will the Economy Recover?
With 2020 nearly behind us, many are eagerly looking ahead to what 2021 will bring. COVID-19 vaccinations have begun, and hope is on the horizon for a stronger economy going forward.
The Organization for Economic Co-operation and Development (OECD) projects that after a 4.2% drop this year, the global economy will reach pre-pandemic levels in 2021. This animation, which uses data from the OECD, shows which countries will recover the fastest from the global recession in 2020.
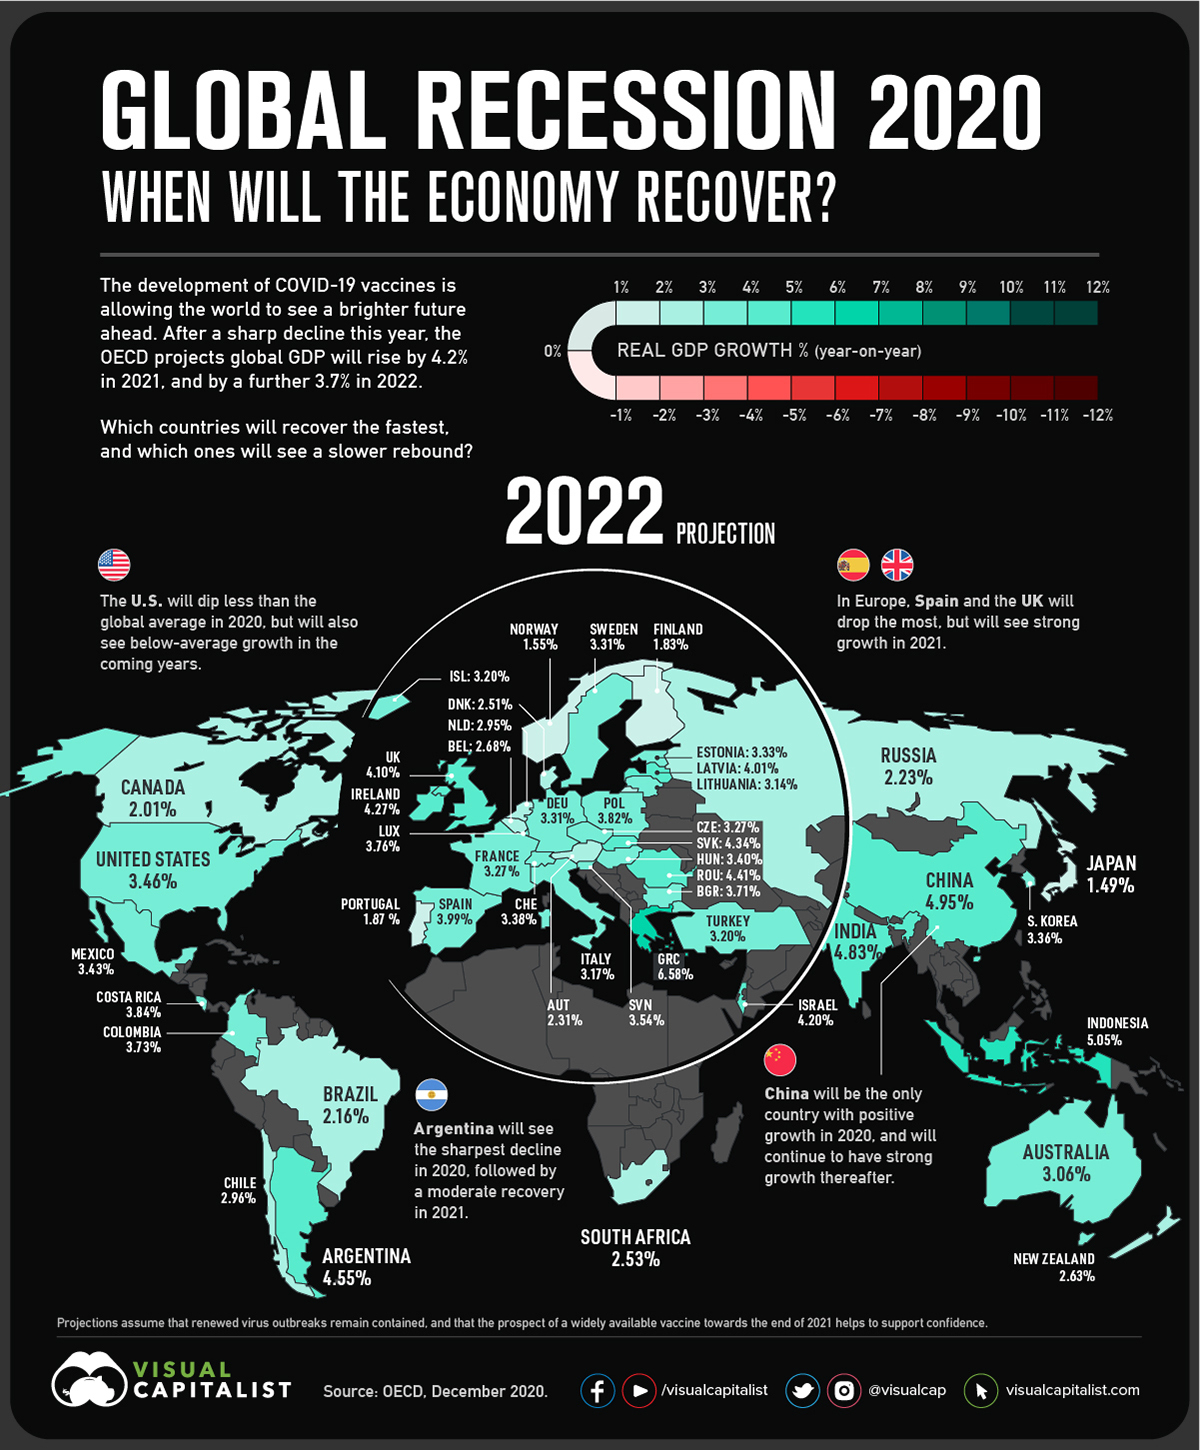
Economic Forecast by Country
The projections assume that renewed virus outbreaks remain contained, and that a widely available vaccine near the end of 2021 helps to support confidence. Information used in the projections, such as monetary and fiscal policies, is as of November 27, 2020.
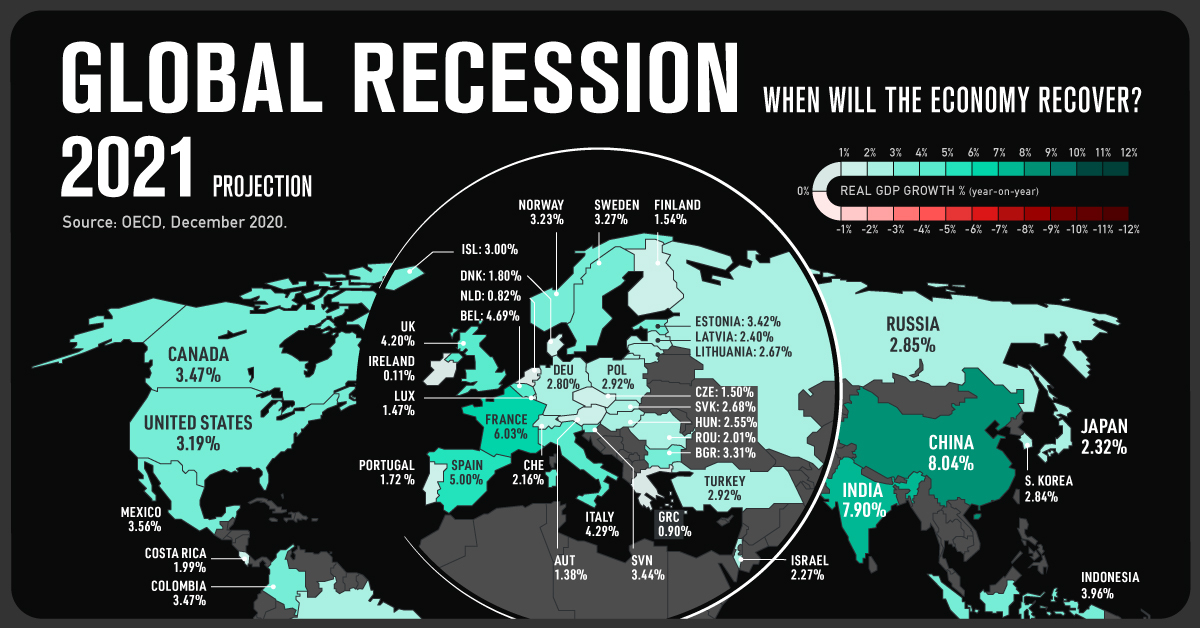
Here is how the economic forecasts break down for both OECD and non-OECD countries, sorted by projected real GDP growth in 2021:
| Country | 2020P | 2021P | 2022P |
|---|---|---|---|
| 🇨🇳 China | 1.78 | 8.04 | 4.95 |
| 🇮🇳 India | -9.86 | 7.90 | 4.83 |
| 🇫🇷 France | -9.11 | 6.03 | 3.27 |
| 🇪🇸 Spain | -11.63 | 5.00 | 3.99 |
| 🇧🇪 Belgium | -7.45 | 4.69 | 2.68 |
| 🇮🇹 Italy | -9.05 | 4.29 | 3.17 |
| 🇨🇱 Chile | -6.04 | 4.25 | 2.96 |
| 🇬🇧 United Kingdom | -11.25 | 4.20 | 4.10 |
| 🇮🇩 Indonesia | -2.43 | 3.96 | 5.05 |
| 🇦🇷 Argentina | -12.92 | 3.71 | 4.55 |
| Mexico | -9.19 | 3.56 | 3.43 |
| Canada | -5.39 | 3.47 | 2.01 |
| Colombia | -8.32 | 3.47 | 3.73 |
| Slovenia | -7.51 | 3.44 | 3.54 |
| Estonia | -4.74 | 3.42 | 3.33 |
| Bulgaria | -4.12 | 3.31 | 3.71 |
| Sweden | -3.22 | 3.27 | 3.31 |
| Australia | -3.83 | 3.24 | 3.06 |
| Norway | -1.18 | 3.23 | 1.55 |
| United States | -3.70 | 3.19 | 3.46 |
| South Africa | -8.13 | 3.09 | 2.53 |
| Iceland | -7.68 | 3.00 | 3.20 |
| Poland | -3.51 | 2.92 | 3.82 |
| Turkey | -1.30 | 2.92 | 3.20 |
| Russia | -4.28 | 2.85 | 2.23 |
| South Korea | -1.09 | 2.84 | 3.36 |
| Germany | -5.53 | 2.80 | 3.31 |
| New Zealand | -4.81 | 2.73 | 2.63 |
| Slovakia | -6.29 | 2.68 | 4.34 |
| Lithuania | -1.95 | 2.67 | 3.14 |
| Brazil | -6.02 | 2.62 | 2.16 |
| Hungary | -5.66 | 2.55 | 3.40 |
| Latvia | -4.35 | 2.40 | 4.01 |
| Japan | -5.29 | 2.32 | 1.49 |
| Israel | -4.15 | 2.27 | 4.20 |
| Switzerland | -4.69 | 2.16 | 3.38 |
| Romania | -5.32 | 2.01 | 4.41 |
| Costa Rica | -5.58 | 1.99 | 3.84 |
| Denmark | -3.88 | 1.80 | 2.51 |
| Portugal | -8.43 | 1.72 | 1.87 |
| Finland | -3.97 | 1.54 | 1.83 |
| Czech Republic | -6.79 | 1.50 | 3.27 |
| Luxembourg | -4.45 | 1.47 | 3.76 |
| Austria | -8.03 | 1.38 | 2.31 |
| Greece | -10.1 | 0.90 | 6.58 |
| Netherlands | -4.55 | 0.82 | 2.95 |
| Ireland | -3.20 | 0.11 | 4.27 |
China started recovering earlier than most countries, and is projected to be the only country with positive GDP growth in 2020. Strong growth will continue in 2021, when China will account for over one-third of global economic growth.
Meanwhile, India experienced one of the world’s tightest lockdowns and will see a large GDP drop in 2020. The decline has exacerbated inequality, as school closures disrupt meal programmes and prompt dropouts by disadvantaged children. While the economy is forecast to grow from 2021-2022, it may take almost two years for GDP to fully recover.
Out of the countries measured in OECD’s forecast, Argentina will see the biggest GDP decline in 2021. Rising unemployment and inflationary pressures have contributed to the decline.
New Zealand’s GDP loss was similar to the OECD average, despite a larger drop in mobility, from the last quarter of 2019 to the second quarter of 2020. A recovery will partially depend on travel restrictions, as tourism accounted for 20% of the country’s total employment in 2019.
A Fragile Recovery
Considerable uncertainty about near-term GDP projections remain—$7 trillion of uncertainty, to be exact.
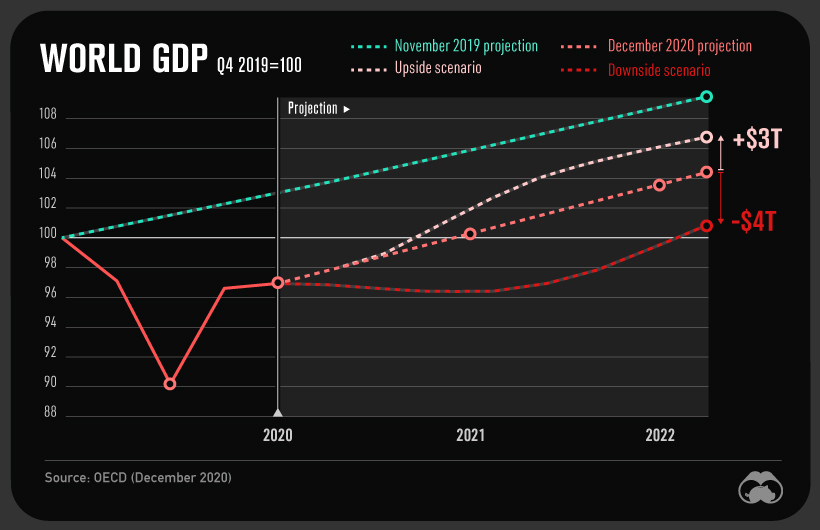
A downside scenario would be caused by delayed vaccinations or new outbreaks, and would lead to a $4 trillion GDP loss by 2022 compared to current projections. An upside scenario, spurred by fast vaccine rollout and boosted consumer and business confidence, could add $3 trillion to the global economy.
However, it is likely that the pandemic has caused permanent losses no matter the scenario.
As we wait for vaccines to be widely available, the OECD recommends that governments implement clear COVID-19 containment measures. While debt-to-GDP ratios have risen substantially due to stimulus packages, the organization also recommends that governments maintain strong fiscal support.
In particular, policies should be directed towards the most vulnerable, such as low-skilled workers, small businesses, and children. This may foster a more even recovery from the global recession of 2020.


Markets
The European Stock Market: Attractive Valuations Offer Opportunities
On average, the European stock market has valuations that are nearly 50% lower than U.S. valuations. But how can you access the market?


European Stock Market: Attractive Valuations Offer Opportunities
Europe is known for some established brands, from L’Oréal to Louis Vuitton. However, the European stock market offers additional opportunities that may be lesser known.
The above infographic, sponsored by STOXX, outlines why investors may want to consider European stocks.
Attractive Valuations
Compared to most North American and Asian markets, European stocks offer lower or comparable valuations.
| Index | Price-to-Earnings Ratio | Price-to-Book Ratio |
|---|---|---|
| EURO STOXX 50 | 14.9 | 2.2 |
| STOXX Europe 600 | 14.4 | 2 |
| U.S. | 25.9 | 4.7 |
| Canada | 16.1 | 1.8 |
| Japan | 15.4 | 1.6 |
| Asia Pacific ex. China | 17.1 | 1.8 |
Data as of February 29, 2024. See graphic for full index names. Ratios based on trailing 12 month financials. The price to earnings ratio excludes companies with negative earnings.
On average, European valuations are nearly 50% lower than U.S. valuations, potentially offering an affordable entry point for investors.
Research also shows that lower price ratios have historically led to higher long-term returns.
Market Movements Not Closely Connected
Over the last decade, the European stock market had low-to-moderate correlation with North American and Asian equities.
The below chart shows correlations from February 2014 to February 2024. A value closer to zero indicates low correlation, while a value of one would indicate that two regions are moving in perfect unison.
| EURO STOXX 50 | STOXX EUROPE 600 | U.S. | Canada | Japan | Asia Pacific ex. China |
|
|---|---|---|---|---|---|---|
| EURO STOXX 50 | 1.00 | 0.97 | 0.55 | 0.67 | 0.24 | 0.43 |
| STOXX EUROPE 600 | 1.00 | 0.56 | 0.71 | 0.28 | 0.48 | |
| U.S. | 1.00 | 0.73 | 0.12 | 0.25 | ||
| Canada | 1.00 | 0.22 | 0.40 | |||
| Japan | 1.00 | 0.88 | ||||
| Asia Pacific ex. China | 1.00 |
Data is based on daily USD returns.
European equities had relatively independent market movements from North American and Asian markets. One contributing factor could be the differing sector weights in each market. For instance, technology makes up a quarter of the U.S. market, but health care and industrials dominate the broader European market.
Ultimately, European equities can enhance portfolio diversification and have the potential to mitigate risk for investors.
Tracking the Market
For investors interested in European equities, STOXX offers a variety of flagship indices:
| Index | Description | Market Cap |
|---|---|---|
| STOXX Europe 600 | Pan-regional, broad market | €10.5T |
| STOXX Developed Europe | Pan-regional, broad-market | €9.9T |
| STOXX Europe 600 ESG-X | Pan-regional, broad market, sustainability focus | €9.7T |
| STOXX Europe 50 | Pan-regional, blue-chip | €5.1T |
| EURO STOXX 50 | Eurozone, blue-chip | €3.5T |
Data is as of February 29, 2024. Market cap is free float, which represents the shares that are readily available for public trading on stock exchanges.
The EURO STOXX 50 tracks the Eurozone’s biggest and most traded companies. It also underlies one of the world’s largest ranges of ETFs and mutual funds. As of November 2023, there were €27.3 billion in ETFs and €23.5B in mutual fund assets under management tracking the index.
“For the past 25 years, the EURO STOXX 50 has served as an accurate, reliable and tradable representation of the Eurozone equity market.”
— Axel Lomholt, General Manager at STOXX
Partnering with STOXX to Track the European Stock Market
Are you interested in European equities? STOXX can be a valuable partner:
- Comprehensive, liquid and investable ecosystem
- European heritage, global reach
- Highly sophisticated customization capabilities
- Open architecture approach to using data
- Close partnerships with clients
- Part of ISS STOXX and Deutsche Börse Group
With a full suite of indices, STOXX can help you benchmark against the European stock market.
Learn how STOXX’s European indices offer liquid and effective market access.

-

 Economy2 days ago
Economic Growth Forecasts for G7 and BRICS Countries in 2024
The IMF has released its economic growth forecasts for 2024. How do the G7 and BRICS countries compare?
-

 Markets1 week ago
U.S. Debt Interest Payments Reach $1 Trillion
U.S. debt interest payments have surged past the $1 trillion dollar mark, amid high interest rates and an ever-expanding debt burden.
-

 United States2 weeks ago
Ranked: The Largest U.S. Corporations by Number of Employees
We visualized the top U.S. companies by employees, revealing the massive scale of retailers like Walmart, Target, and Home Depot.
-

 Markets2 weeks ago
The Top 10 States by Real GDP Growth in 2023
This graphic shows the states with the highest real GDP growth rate in 2023, largely propelled by the oil and gas boom.
-

 Markets2 weeks ago
Ranked: The World’s Top Flight Routes, by Revenue
In this graphic, we show the highest earning flight routes globally as air travel continued to rebound in 2023.
-

 Markets3 weeks ago
Ranked: The Most Valuable Housing Markets in America
The U.S. residential real estate market is worth a staggering $47.5 trillion. Here are the most valuable housing markets in the country.


-

 Education1 week ago
How Hard Is It to Get Into an Ivy League School?
-

 Technology2 weeks ago
Ranked: Semiconductor Companies by Industry Revenue Share
-
Markets2 weeks ago
Ranked: The World’s Top Flight Routes, by Revenue
-

 Demographics2 weeks ago
Population Projections: The World’s 6 Largest Countries in 2075
-
Markets2 weeks ago
The Top 10 States by Real GDP Growth in 2023
-

 Demographics2 weeks ago
The Smallest Gender Wage Gaps in OECD Countries
-

 Economy2 weeks ago
Where U.S. Inflation Hit the Hardest in March 2024
-

 Green2 weeks ago
Top Countries By Forest Growth Since 2001