Economy
This Simple Chart Reveals the Distribution Of Global Wealth


The Global Wealth Distribution in One Chart
The pandemic resulted in global wealth taking a significant dip in the first part of 2020. By the end of March, global household wealth had already declined by around 4.4%.
Interestingly, after much monetary and fiscal stimulus from governments around the world, global household wealth was more than able to recover, finishing up the year at $418.3 trillion, a 7.4% gain from the previous year.
Using data from Credit Suisse, this graphic looks at how global wealth is distributed among the adult population.
How is Global Wealth Distributed?
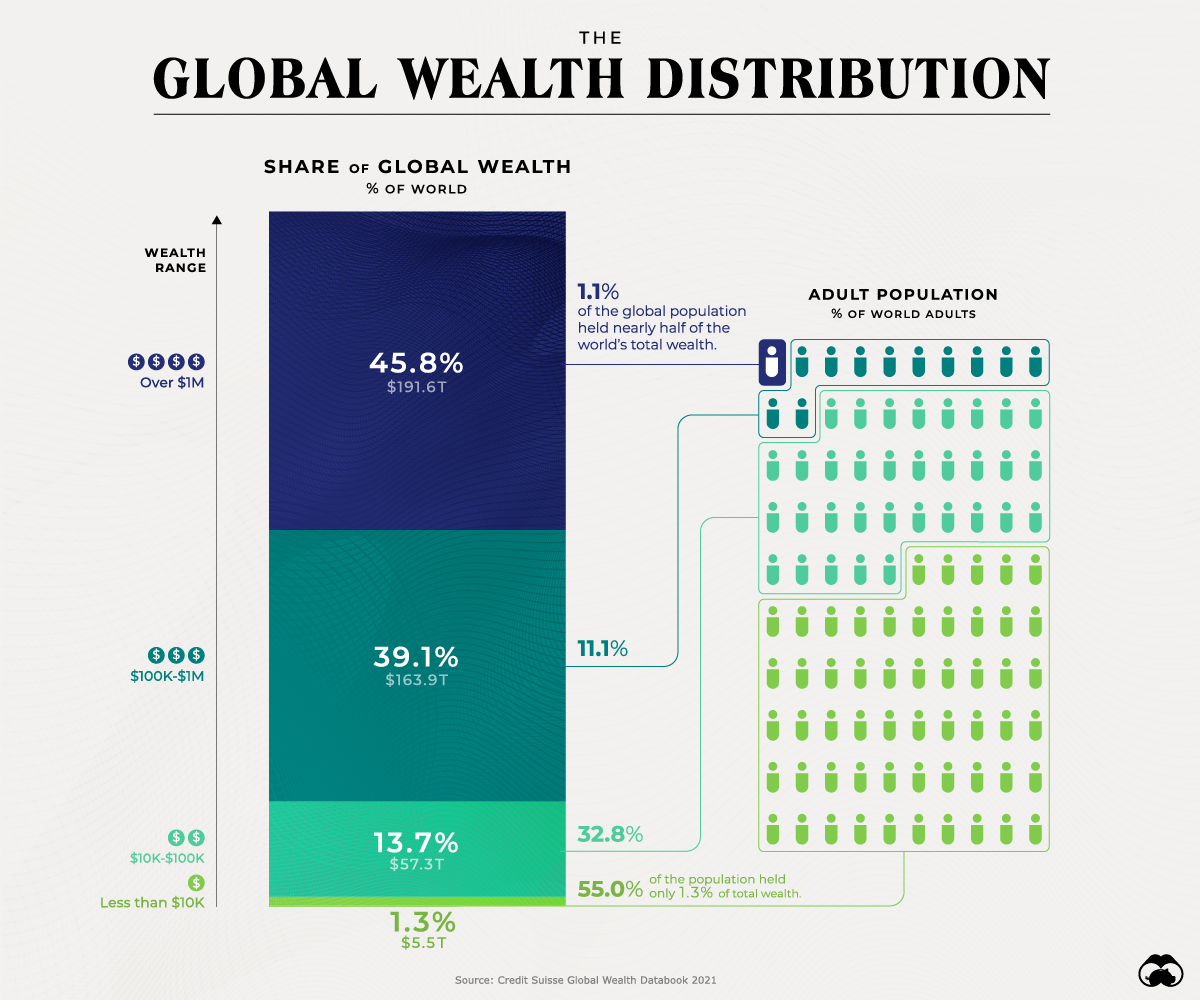
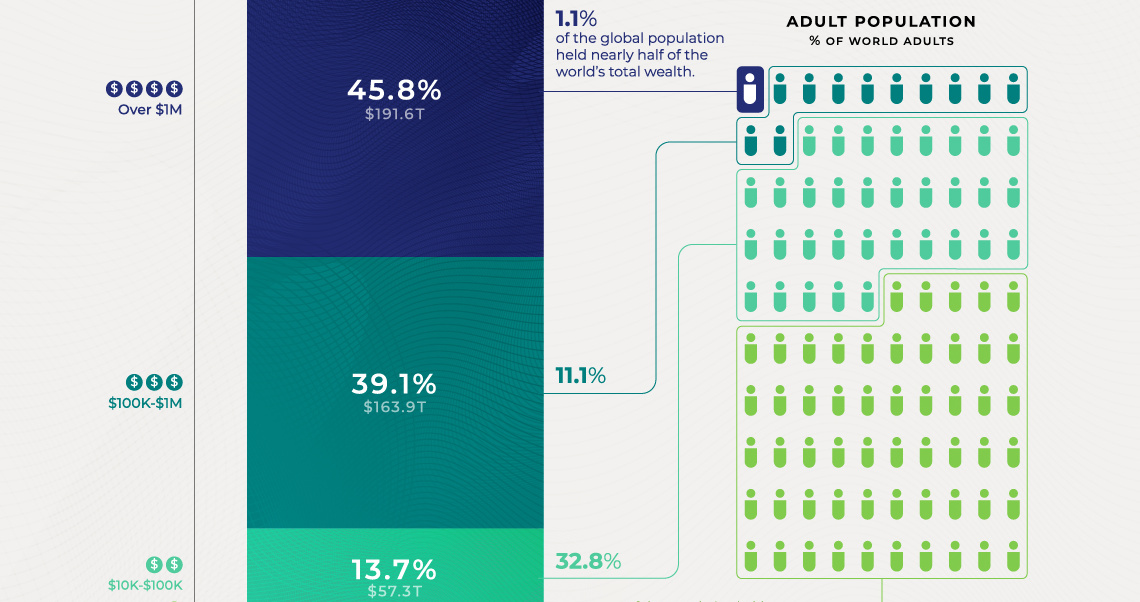
While individuals worth more than $1 million constitute just 1.1% of the world’s population, they hold 45.8% of global wealth.
| Wealth Range | Wealth | Global Share (%) | Adult Population |
|---|---|---|---|
| Over $1M | $191.6 trillion | 45.8% | Held by 1.1% |
| $100k-$1M | $163.9 trillion | 39.1% | Held by 11.1% |
| $10k-$100k | $57.3 trillion | 13.7% | Held by 32.8% |
| Less than $10k | $5.5 trillion | 1.3% | Held by 55.0% |
| Total | $418.3 trillion | 100.0% | Held by 100.0% |
On the other end of the spectrum, 55% of the population owns only 1.3% of global wealth.
And between these two extreme wealth distribution cases, the rest of the world’s population has a combined 52.8% of the wealth.
Global Wealth Distribution by Region
While wealth inequality is especially evident within the wealth ranges mentioned above, these differences can also be seen on a more regional basis between countries.
In 2020, total wealth rose by $12.4 trillion in North America and $9.2 trillion in Europe. These two regions accounted for the bulk of the wealth gains, with China adding another $4.2 trillion and the Asia-Pacific region (excluding China and India) another $4.7 trillion.
Here is a breakdown of global wealth distribution by region:
| Region | Total Wealth (US$B) | Change in Total Wealth (US$B) | Change % | Wealth Per Adult (US$) | Change % |
|---|---|---|---|---|---|
| North America | 136,316 | 12,370 | 10.0 | 486,930 | 9.1 |
| Europe | 103,213 | 9,179 | 9.8 | 174,836 | 9.8 |
| Asia-Pacific | 75,277 | 4,694 | 6.7 | 60,790 | 5.0 |
| China | 74,884 | 4,246 | 6.0 | 67,771 | 5.4 |
| India | 12,833 | -594 | -4.4 | 14,252 | -6.1 |
| Latin America | 10,872 | -1,215 | -10.1 | 24,301 | -11.4 |
| Africa | 4,946 | 36 | 0.7 | 7,371 | -2.1 |
| World | 418,342 | 28,716 | 7.4 | 79,952 | 6.0 |
India and Latin America both recorded losses in 2020.
Total wealth fell in India by $594 billion, or 4.4%. Meanwhile, Latin America appears to have been the worst-performing region, with total wealth dropping by 11.4% or $1.2 trillion.
Post-COVID Global Outlook 2020-2025
Despite the burden of COVID-19 on the global economy, the world can expect robust GDP growth in the coming years, especially in 2021. The latest estimates by the International Monetary Fund in April 2021 suggest that global GDP in 2021 will total $100.1 trillion in nominal terms, up by 4.1% compared to last year.
The link in normal times between GDP growth and household wealth growth, combined with the expected rapid return of economic activity to its pre-pandemic levels, suggests that global wealth could grow again at a fast pace. According to Credit Suisse estimates, global wealth may rise by 39% over the next five years.
Low and middle-income countries will also play an essential role in the coming year. They are responsible for 42% of the growth, even though they account for just 33% of current wealth.


United States
Charted: Trust in Government Institutions by G7 Countries
How much do you trust the government and its various institutions? We look at data for G7 countries for the time period of 2006-2023.


Trust in Government Institutions by G7 Countries
This was originally posted on our Voronoi app. Download the app for free on iOS or Android and discover incredible data-driven charts from a variety of trusted sources.
How much do you trust the government, and its various institutions?
It’s likely that your level of confidence probably depends on a wide range of factors, such as perceived competency, historical context, economic performance, accountability, social cohesion, and transparency.
And for these same reasons, trust levels in government institutions also change all the time, even in the world’s most developed countries: the G7.
Confidence in Government by G7 Countries (2006-2023)
This chart looks at the changes in trust in government institutions between the years 2006 and 2023, based on data from a multi-country Gallup poll.
Specifically, this dataset aggregates confidence in multiple national institutions, including the military, the judicial system, the national government, and the integrity of the electoral system.
| Country | Confidence (2006) | Confidence (2023) | Change (p.p.) |
|---|---|---|---|
| Canada | 57% | 64% | +7 |
| Britain | 63% | 63% | +0 |
| Germany | 55% | 61% | +6 |
| France | 54% | 60% | +6 |
| Japan | 48% | 59% | +11 |
| Italy | 41% | 54% | +13 |
| United States | 63% | 50% | -13 |
What’s interesting here is that in the G7, a group of the world’s most developed economies, there is only one country bucking the general trend: the United States.
Across most G7 countries, confidence in institutions has either improved or stayed the same between 2006 and 2023. The largest percentage point (p.p.) increases occur in Italy and Japan, which saw +13 p.p. and +11 p.p. increases in trust over the time period.
In the U.S., however, confidence in government institutions has fallen by 13 p.p. over the years. What happened?
Key Figures on U.S. Trust in Institutions
In 2006, the U.S. was tied with the UK as having the highest confidence in government institutions, at 63%.
But here’s where the scores stand in 2023, across various institutions:
| 🇺🇸 Institutions | Confidence (2023) |
|---|---|
| Military | 81% |
| Judiciary | 42% |
| National Government | 30% |
| Elections | 44% |
| Overall | 49% |
Based on this data, it’s clear that the U.S. lags behind in three key indicators: confidence in the national government, confidence in the justice system, and confidence in fair elections. It ranked in last place for each indicator in the G7.
One other data point that stands out: despite leading the world in military spending, the U.S. is only the third most confident in its military in the G7. It lags behind France (86%) and the United Kingdom (83%).

-

 Wealth6 days ago
Charted: Which City Has the Most Billionaires in 2024?
-

 Mining2 weeks ago
Gold vs. S&P 500: Which Has Grown More Over Five Years?
-

 Uranium2 weeks ago
The World’s Biggest Nuclear Energy Producers
-

 Education2 weeks ago
How Hard Is It to Get Into an Ivy League School?
-

 Debt2 weeks ago
How Debt-to-GDP Ratios Have Changed Since 2000
-

 Sports2 weeks ago
The Highest Earning Athletes in Seven Professional Sports
-

 Science2 weeks ago
Visualizing the Average Lifespans of Mammals
-

 Brands1 week ago
How Tech Logos Have Evolved Over Time