Markets
Mapped: The World’s Largest Economies, Sized by GDP (1970-2020)
Article/Editing:
How to Use: The below slideshow will animate automatically. To pause, move your cursor on the image. Arrows on left/right navigate.

View the full-size version of all three graphics
Visualizing The World’s Largest Economies (1970-2020)
Global GDP has grown massively over the last 50 years, but not all countries experienced this economic growth equally.
In 1970, the world’s nominal GDP was just $3.4 trillion. Fast forward a few decades and it had reached $85.3 trillion by 2020. And thanks to shifting dynamics, such as industrialization and the rise and fall of political regimes, the world’s largest economies driving this global growth have changed over time.
This slideshow using graphics from Ruben Berge Mathisen show the distribution of global GDP among countries in 1970, 1995, and 2020.
Methodology
Using data from the United Nations, Mathisen collected nominal GDP in U.S. dollars for each country. He then determined each country’s GDP as a share of global GDP and sized each graphic’s bubbles accordingly.
The bubbles were placed according to country latitude and longitude coordinates, but Mathisen programmed the bubbles so that they wouldn’t overlap with each other. For this reason, some countries are slightly displaced from their exact locations on a map.
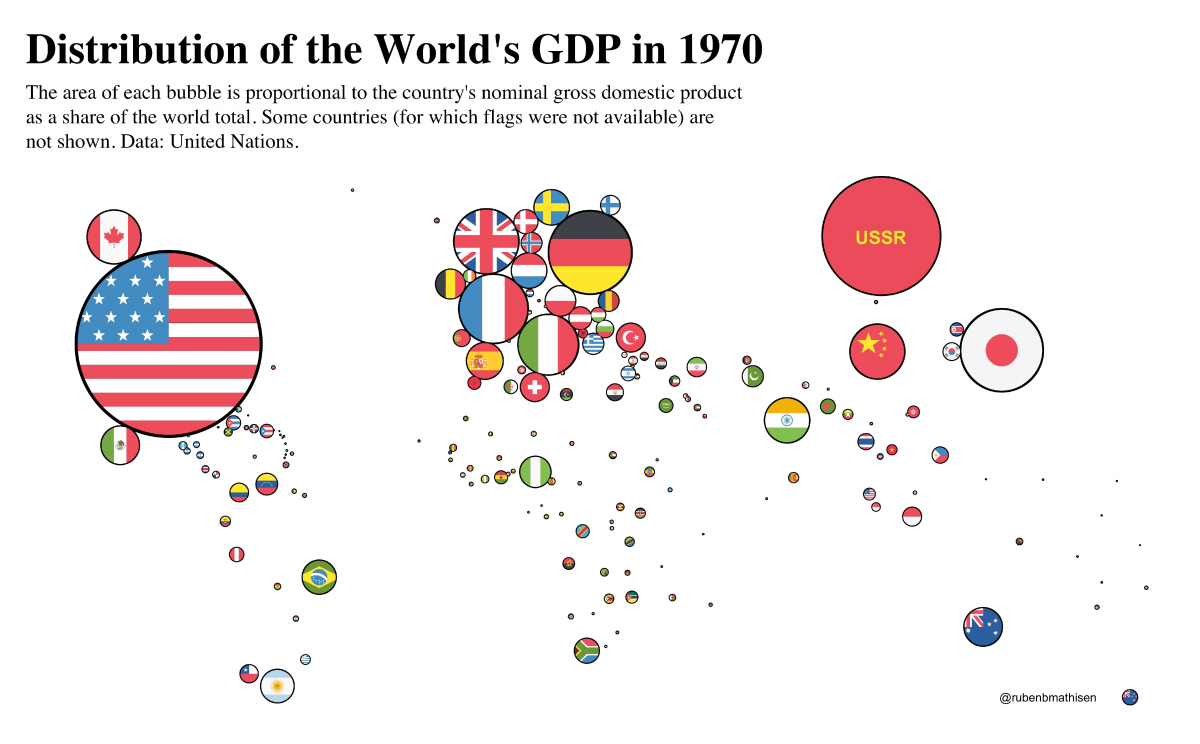
1970: USSR as a Major Player
In 1970, the U.S. accounted for the largest share of global GDP, making up nearly one-third of the world economy. The table below shows the top 10 economies in 1970.
| Rank | Country | GDP (1970) | Share of Global GDP |
|---|---|---|---|
| #1 | 🇺🇸 United States | $1.1T | 31.4 % |
| #2 | ☭ USSR | $433B | 12.7 % |
| #3 | 🇩🇪 Germany | $216B | 6.3 % |
| #4 | 🇯🇵 Japan | $213B | 6.2 % |
| #5 | 🇫🇷 France | $148B | 4.3 % |
| #6 | 🇬🇧 UK | $131B | 3.8 % |
| #7 | 🇮🇹 Italy | $113B | 3.3 % |
| #8 | 🇨🇳 China | $93B | 2.7 % |
| #9 | 🇨🇦 Canada | $89B | 2.6 % |
| #10 | 🇮🇳 India | $62B | 1.8 % |
Then a global superpower, the former Union of Soviet Socialist Republics (USSR) came in second place on the list of the world’s largest economies.
In the years leading up to 1970, the USSR had seen impressive GDP growth largely due to adopting Western technologies that increased productivity. However, the USSR’s economy began to stagnate in the ‘70s, and eventually collapsed in 1991.
On the other side, Germany (including both West and East Germany) was the third-largest economy in 1970 after rising from economic ruin following World War II. West Germany’s “Economic Miracle” is largely credited to the introduction of a new currency to replace the Riechsmark, large tax cuts brought in to spur investment, and the removal of price controls.
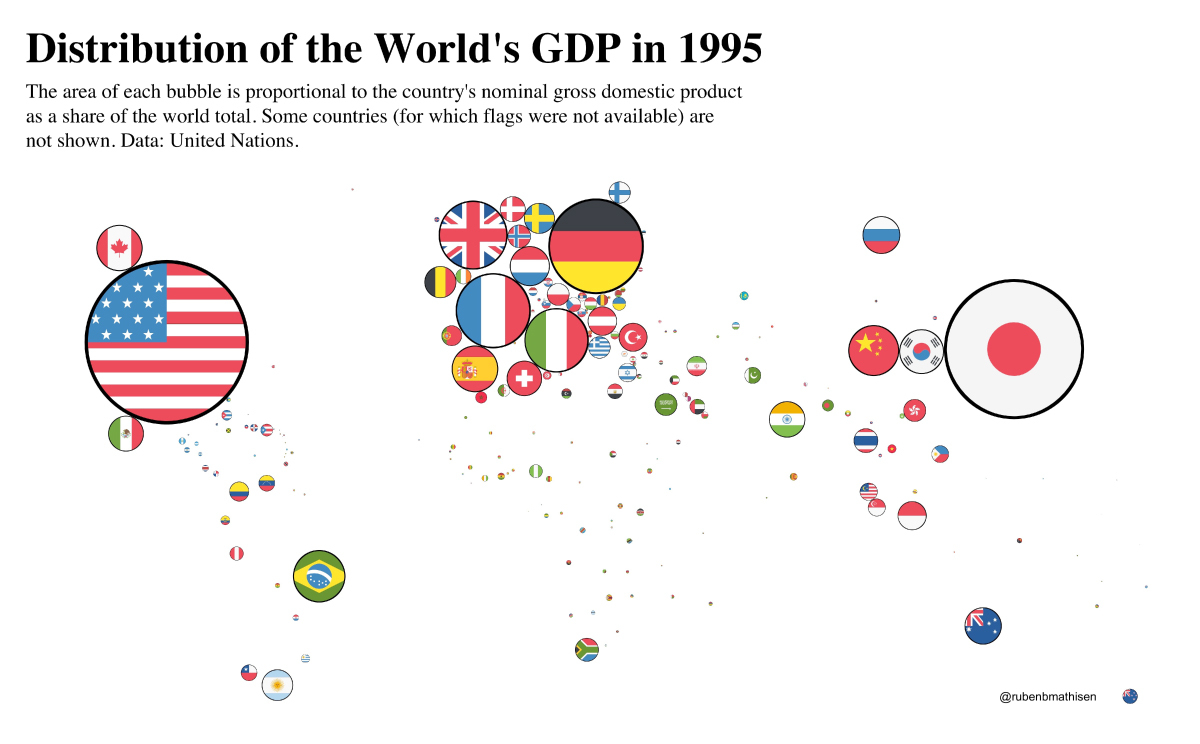
1995: Japan Begins to Slow Down
By 1995, the U.S. still held the top spot on the world’s largest economies list, but the country’s share of global GDP had shrunk.
| Rank | Country/Area | GDP (1995) | Share of Global GDP |
|---|---|---|---|
| #1 | 🇺🇸 United States | $7.6T | 24.4 % |
| #2 | 🇯🇵 Japan | $5.5T | 17.7 % |
| #3 | 🇩🇪 Germany | $2.6T | 8.3 % |
| #4 | 🇫🇷 France | $1.6T | 5.1 % |
| #5 | 🇬🇧 UK | $1.3T | 4.3 % |
| #6 | 🇮🇹 Italy | $1.2T | 3.8 % |
| #7 | 🇧🇷 Brazil | $778B | 2.5 % |
| #8 | 🇨🇳 China | $734B | 2.4 % |
| #9 | 🇪🇸 Spain | $615B | 2.0 % |
| #10 | 🇨🇦 Canada | $606B | 1.9 % |
Meanwhile, Japan had leapfrogged into second place and nearly tripled its share of the global economy compared to 1970. A number of factors played into Japan’s economic success:
- Large business groups known as keiretsu used their connections to undercut rivals
- Fierce competition between companies encouraged innovation
- Tax breaks and cheap credit stimulated investment
- The well-educated workforce was willing to work extremely long hours
But around 1990, the country’s economy had actually begun to slow down. Japan’s decreasing labor force participation rate and diminishing returns from higher education both could have played a role.
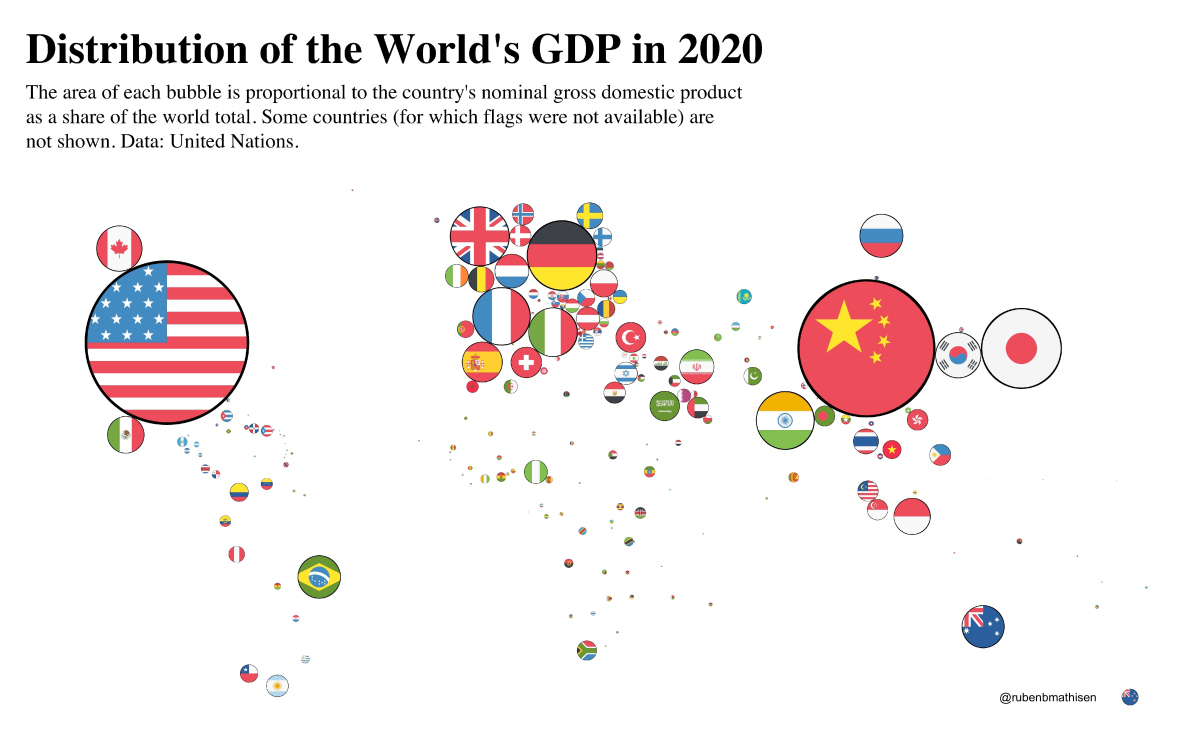
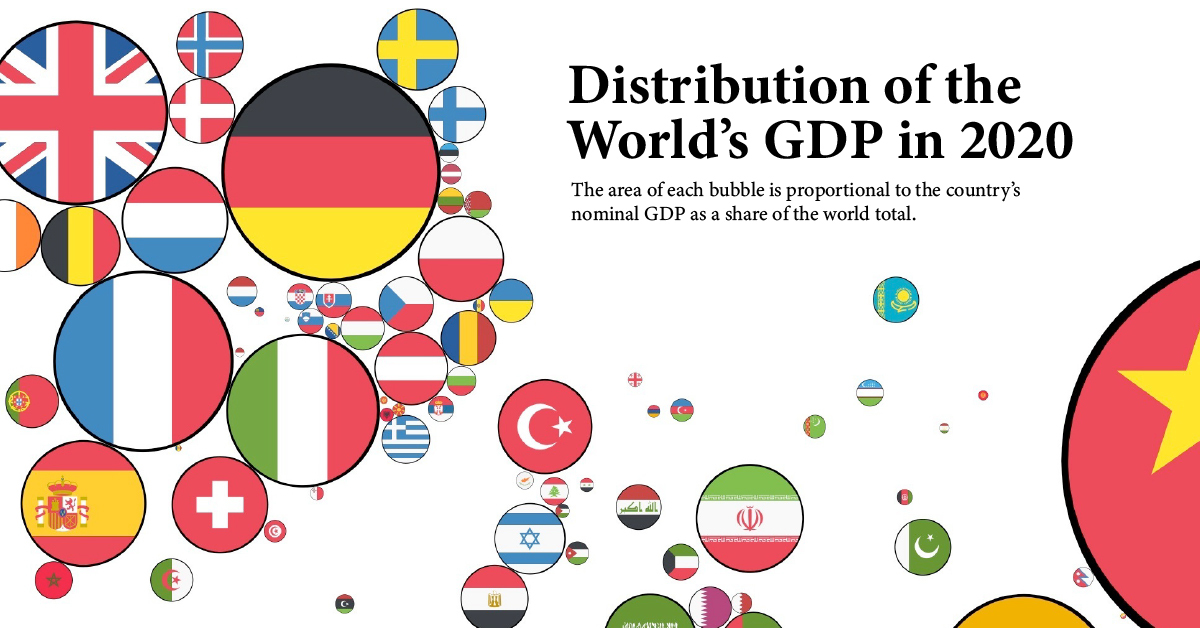
2020: The World’s Largest Economies Shift Again
In 2020, the United States continued to hold onto the number one spot among the world’s largest economies. However, Japan’s slowdown created a rare opportunity for a new powerhouse to emerge: China.
| Rank | Country/Area | GDP (2020) | Share of Global GDP |
|---|---|---|---|
| #1 | 🇺🇸 United States | $20.9T | 24.5 % |
| #2 | 🇨🇳 China | $14.7T | 17.3 % |
| #3 | 🇯🇵 Japan | $5.1T | 5.9 % |
| #4 | 🇩🇪 Germany | $3.8T | 4.5 % |
| #5 | 🇬🇧 UK | $2.8T | 3.2 % |
| #6 | 🇮🇳 India | $2.7T | 3.1 % |
| #7 | 🇫🇷 France | $2.6T | 3.1 % |
| #8 | 🇮🇹 Italy | $1.9T | 2.2 % |
| #9 | 🇨🇦 Canada | $1.6T | 1.9 % |
| #10 | 🇰🇷 South Korea | $1.6T | 1.9 % |
China’s economy saw incredible growth following economic reforms in 1978. The reforms encouraged the formation of private businesses, liberalized foreign trade and investment, relaxed state control over some prices, and invested in industrial production and the education of its workforce. With profit incentives introduced to private businesses, productivity increased.
China was also positioned as a cheap manufacturing hub for multinational corporations. Since rising into contention, the country has become the world’s largest exporter.
India held the title of the sixth largest economy in 2020. Similar to China, the country’s growth came from relaxed economic restrictions, and it has seen particularly strong growth within the service sector, including telecommunications, IT, and software.
With dynamics shifting, which countries will be on the leaderboard in another 25 years?

This article was published as a part of Visual Capitalist's Creator Program, which features data-driven visuals from some of our favorite Creators around the world.


Economy
Economic Growth Forecasts for G7 and BRICS Countries in 2024
The IMF has released its economic growth forecasts for 2024. How do the G7 and BRICS countries compare?


G7 & BRICS Real GDP Growth Forecasts for 2024
The International Monetary Fund’s (IMF) has released its real gross domestic product (GDP) growth forecasts for 2024, and while global growth is projected to stay steady at 3.2%, various major nations are seeing declining forecasts.
This chart visualizes the 2024 real GDP growth forecasts using data from the IMF’s 2024 World Economic Outlook for G7 and BRICS member nations along with Saudi Arabia, which is still considering an invitation to join the bloc.
Get the Key Insights of the IMF’s World Economic Outlook
Want a visual breakdown of the insights from the IMF’s 2024 World Economic Outlook report?
This visual is part of a special dispatch of the key takeaways exclusively for VC+ members.
Get the full dispatch of charts by signing up to VC+.
Mixed Economic Growth Prospects for Major Nations in 2024
Economic growth projections by the IMF for major nations are mixed, with the majority of G7 and BRICS countries forecasted to have slower growth in 2024 compared to 2023.
Only three BRICS-invited or member countries, Saudi Arabia, the UAE, and South Africa, have higher projected real GDP growth rates in 2024 than last year.
| Group | Country | Real GDP Growth (2023) | Real GDP Growth (2024P) |
|---|---|---|---|
| G7 | 🇺🇸 U.S. | 2.5% | 2.7% |
| G7 | 🇨🇦 Canada | 1.1% | 1.2% |
| G7 | 🇯🇵 Japan | 1.9% | 0.9% |
| G7 | 🇫🇷 France | 0.9% | 0.7% |
| G7 | 🇮🇹 Italy | 0.9% | 0.7% |
| G7 | 🇬🇧 UK | 0.1% | 0.5% |
| G7 | 🇩🇪 Germany | -0.3% | 0.2% |
| BRICS | 🇮🇳 India | 7.8% | 6.8% |
| BRICS | 🇨🇳 China | 5.2% | 4.6% |
| BRICS | 🇦🇪 UAE | 3.4% | 3.5% |
| BRICS | 🇮🇷 Iran | 4.7% | 3.3% |
| BRICS | 🇷🇺 Russia | 3.6% | 3.2% |
| BRICS | 🇪🇬 Egypt | 3.8% | 3.0% |
| BRICS-invited | 🇸🇦 Saudi Arabia | -0.8% | 2.6% |
| BRICS | 🇧🇷 Brazil | 2.9% | 2.2% |
| BRICS | 🇿🇦 South Africa | 0.6% | 0.9% |
| BRICS | 🇪🇹 Ethiopia | 7.2% | 6.2% |
| 🌍 World | 3.2% | 3.2% |
China and India are forecasted to maintain relatively high growth rates in 2024 at 4.6% and 6.8% respectively, but compared to the previous year, China is growing 0.6 percentage points slower while India is an entire percentage point slower.
On the other hand, four G7 nations are set to grow faster than last year, which includes Germany making its comeback from its negative real GDP growth of -0.3% in 2023.
Faster Growth for BRICS than G7 Nations
Despite mostly lower growth forecasts in 2024 compared to 2023, BRICS nations still have a significantly higher average growth forecast at 3.6% compared to the G7 average of 1%.
While the G7 countries’ combined GDP is around $15 trillion greater than the BRICS nations, with continued higher growth rates and the potential to add more members, BRICS looks likely to overtake the G7 in economic size within two decades.
BRICS Expansion Stutters Before October 2024 Summit
BRICS’ recent expansion has stuttered slightly, as Argentina’s newly-elected president Javier Milei declined its invitation and Saudi Arabia clarified that the country is still considering its invitation and has not joined BRICS yet.
Even with these initial growing pains, South Africa’s Foreign Minister Naledi Pandor told reporters in February that 34 different countries have submitted applications to join the growing BRICS bloc.
Any changes to the group are likely to be announced leading up to or at the 2024 BRICS summit which takes place October 22-24 in Kazan, Russia.
Get the Full Analysis of the IMF’s Outlook on VC+
This visual is part of an exclusive special dispatch for VC+ members which breaks down the key takeaways from the IMF’s 2024 World Economic Outlook.
For the full set of charts and analysis, sign up for VC+.

-

 Mining1 week ago
Gold vs. S&P 500: Which Has Grown More Over Five Years?
-

 Markets2 weeks ago
Ranked: The Most Valuable Housing Markets in America
-

 Money2 weeks ago
Which States Have the Highest Minimum Wage in America?
-

 AI2 weeks ago
Ranked: Semiconductor Companies by Industry Revenue Share
-

 Markets2 weeks ago
Ranked: The World’s Top Flight Routes, by Revenue
-

 Countries2 weeks ago
Population Projections: The World’s 6 Largest Countries in 2075
-

 Markets2 weeks ago
The Top 10 States by Real GDP Growth in 2023
-

 Demographics2 weeks ago
The Smallest Gender Wage Gaps in OECD Countries