Markets
Mapped: The World’s Largest Economies, Sized by GDP (1970-2020)
Article/Editing:
How to Use: The below slideshow will animate automatically. To pause, move your cursor on the image. Arrows on left/right navigate.

View the full-size version of all three graphics
Visualizing The World’s Largest Economies (1970-2020)
Global GDP has grown massively over the last 50 years, but not all countries experienced this economic growth equally.
In 1970, the world’s nominal GDP was just $3.4 trillion. Fast forward a few decades and it had reached $85.3 trillion by 2020. And thanks to shifting dynamics, such as industrialization and the rise and fall of political regimes, the world’s largest economies driving this global growth have changed over time.
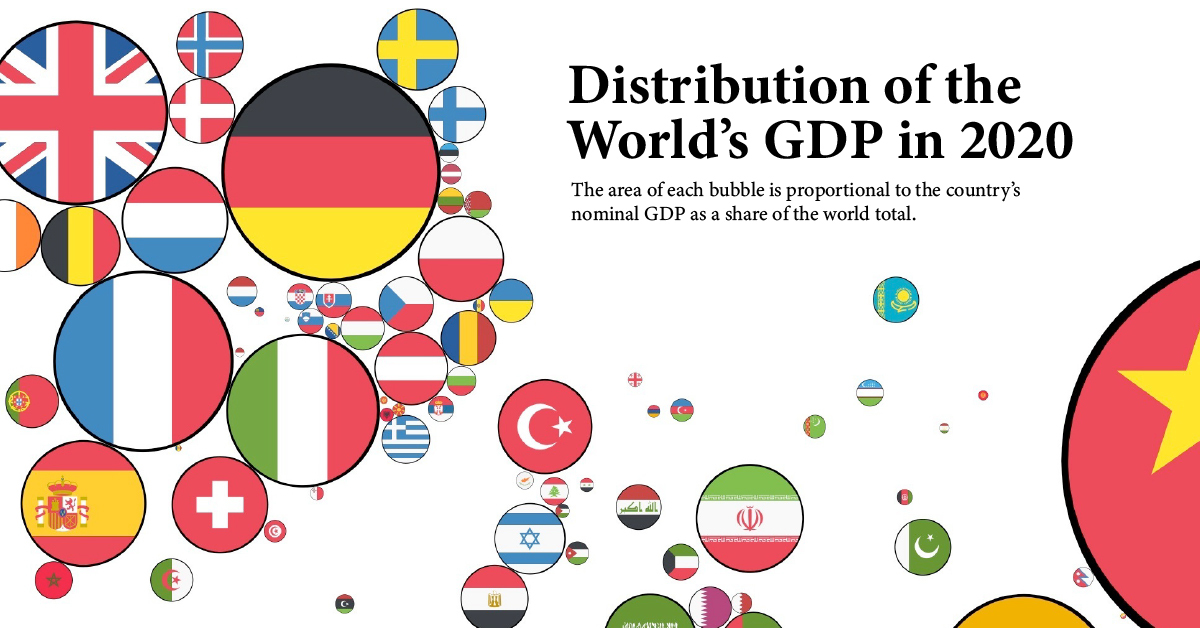
This slideshow using graphics from Ruben Berge Mathisen show the distribution of global GDP among countries in 1970, 1995, and 2020.
Methodology
Using data from the United Nations, Mathisen collected nominal GDP in U.S. dollars for each country. He then determined each country’s GDP as a share of global GDP and sized each graphic’s bubbles accordingly.
The bubbles were placed according to country latitude and longitude coordinates, but Mathisen programmed the bubbles so that they wouldn’t overlap with each other. For this reason, some countries are slightly displaced from their exact locations on a map.
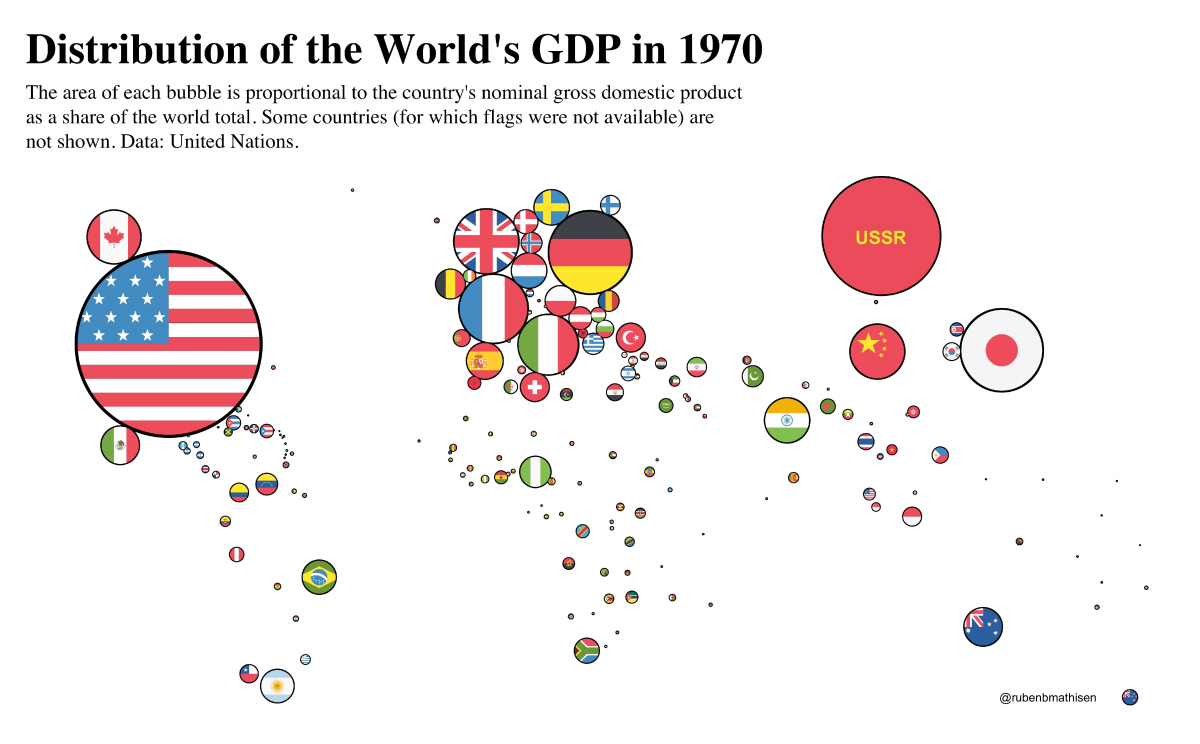
1970: USSR as a Major Player
In 1970, the U.S. accounted for the largest share of global GDP, making up nearly one-third of the world economy. The table below shows the top 10 economies in 1970.
| Rank | Country | GDP (1970) | Share of Global GDP |
|---|---|---|---|
| #1 | 🇺🇸 United States | $1.1T | 31.4 % |
| #2 | ☭ USSR | $433B | 12.7 % |
| #3 | 🇩🇪 Germany | $216B | 6.3 % |
| #4 | 🇯🇵 Japan | $213B | 6.2 % |
| #5 | 🇫🇷 France | $148B | 4.3 % |
| #6 | 🇬🇧 UK | $131B | 3.8 % |
| #7 | 🇮🇹 Italy | $113B | 3.3 % |
| #8 | 🇨🇳 China | $93B | 2.7 % |
| #9 | 🇨🇦 Canada | $89B | 2.6 % |
| #10 | 🇮🇳 India | $62B | 1.8 % |
Then a global superpower, the former Union of Soviet Socialist Republics (USSR) came in second place on the list of the world’s largest economies.
In the years leading up to 1970, the USSR had seen impressive GDP growth largely due to adopting Western technologies that increased productivity. However, the USSR’s economy began to stagnate in the ‘70s, and eventually collapsed in 1991.
On the other side, Germany (including both West and East Germany) was the third-largest economy in 1970 after rising from economic ruin following World War II. West Germany’s “Economic Miracle” is largely credited to the introduction of a new currency to replace the Riechsmark, large tax cuts brought in to spur investment, and the removal of price controls.
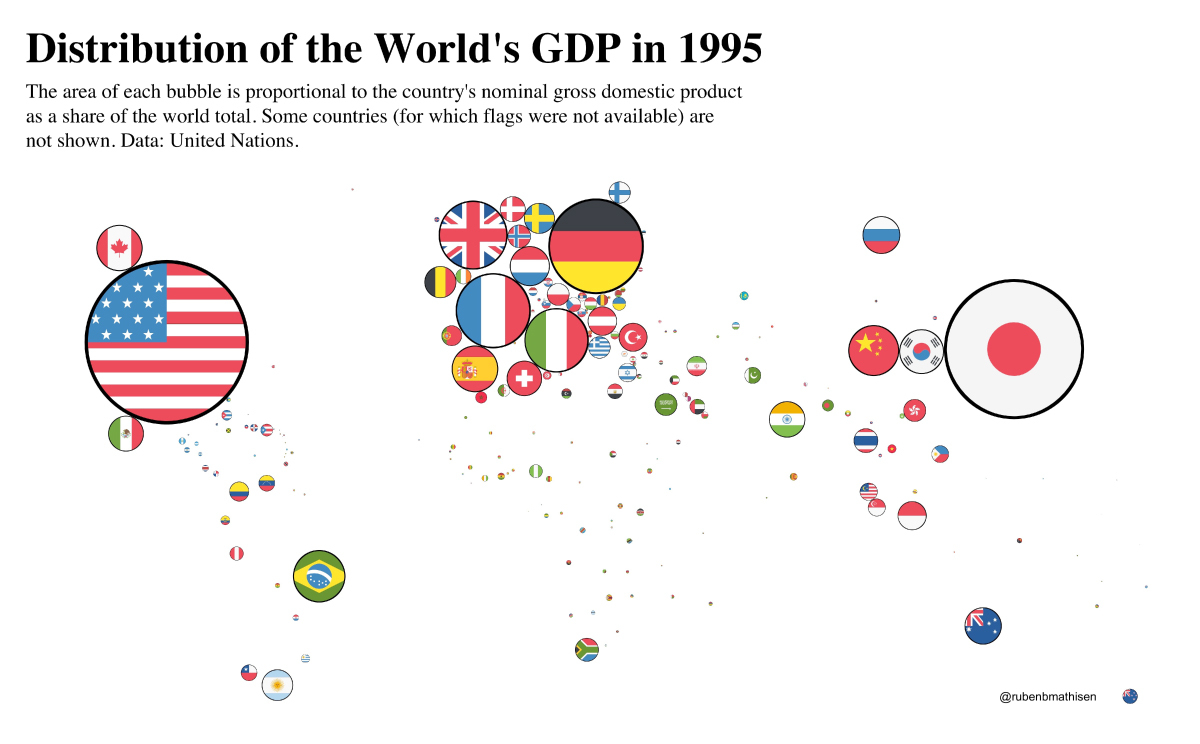
1995: Japan Begins to Slow Down
By 1995, the U.S. still held the top spot on the world’s largest economies list, but the country’s share of global GDP had shrunk.
| Rank | Country/Area | GDP (1995) | Share of Global GDP |
|---|---|---|---|
| #1 | 🇺🇸 United States | $7.6T | 24.4 % |
| #2 | 🇯🇵 Japan | $5.5T | 17.7 % |
| #3 | 🇩🇪 Germany | $2.6T | 8.3 % |
| #4 | 🇫🇷 France | $1.6T | 5.1 % |
| #5 | 🇬🇧 UK | $1.3T | 4.3 % |
| #6 | 🇮🇹 Italy | $1.2T | 3.8 % |
| #7 | 🇧🇷 Brazil | $778B | 2.5 % |
| #8 | 🇨🇳 China | $734B | 2.4 % |
| #9 | 🇪🇸 Spain | $615B | 2.0 % |
| #10 | 🇨🇦 Canada | $606B | 1.9 % |
Meanwhile, Japan had leapfrogged into second place and nearly tripled its share of the global economy compared to 1970. A number of factors played into Japan’s economic success:
- Large business groups known as keiretsu used their connections to undercut rivals
- Fierce competition between companies encouraged innovation
- Tax breaks and cheap credit stimulated investment
- The well-educated workforce was willing to work extremely long hours
But around 1990, the country’s economy had actually begun to slow down. Japan’s decreasing labor force participation rate and diminishing returns from higher education both could have played a role.
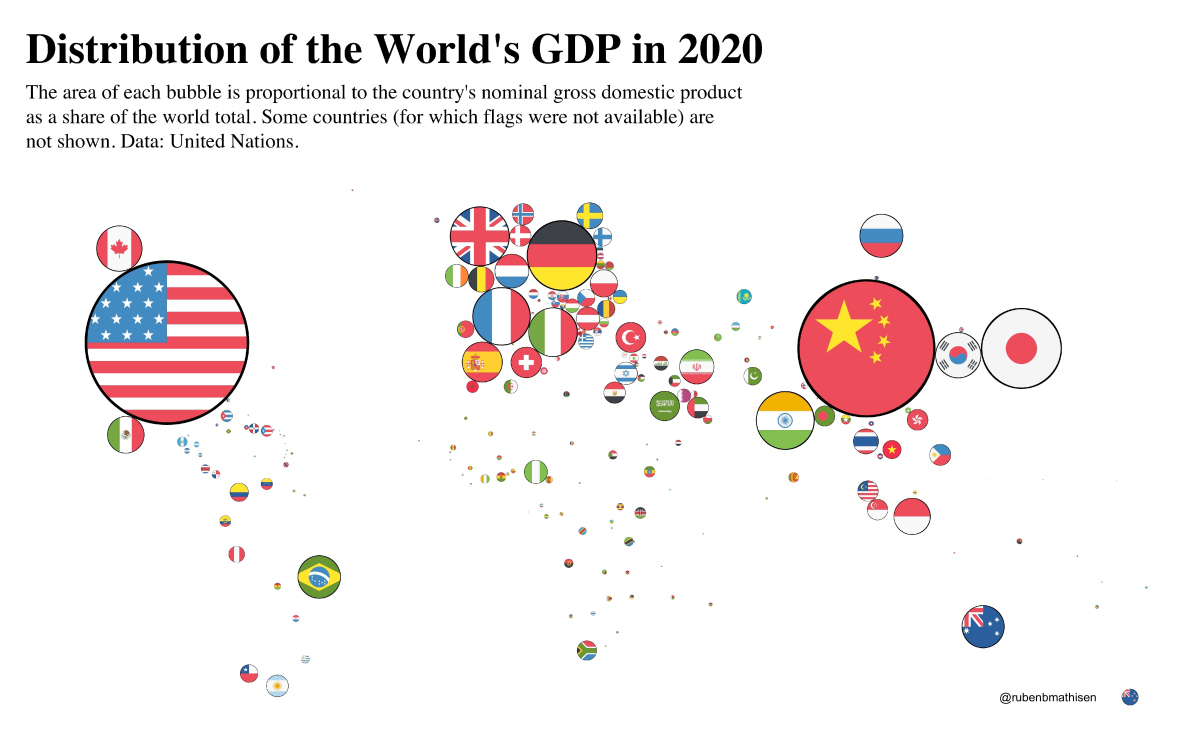
2020: The World’s Largest Economies Shift Again
In 2020, the United States continued to hold onto the number one spot among the world’s largest economies. However, Japan’s slowdown created a rare opportunity for a new powerhouse to emerge: China.
| Rank | Country/Area | GDP (2020) | Share of Global GDP |
|---|---|---|---|
| #1 | 🇺🇸 United States | $20.9T | 24.5 % |
| #2 | 🇨🇳 China | $14.7T | 17.3 % |
| #3 | 🇯🇵 Japan | $5.1T | 5.9 % |
| #4 | 🇩🇪 Germany | $3.8T | 4.5 % |
| #5 | 🇬🇧 UK | $2.8T | 3.2 % |
| #6 | 🇮🇳 India | $2.7T | 3.1 % |
| #7 | 🇫🇷 France | $2.6T | 3.1 % |
| #8 | 🇮🇹 Italy | $1.9T | 2.2 % |
| #9 | 🇨🇦 Canada | $1.6T | 1.9 % |
| #10 | 🇰🇷 South Korea | $1.6T | 1.9 % |
China’s economy saw incredible growth following economic reforms in 1978. The reforms encouraged the formation of private businesses, liberalized foreign trade and investment, relaxed state control over some prices, and invested in industrial production and the education of its workforce. With profit incentives introduced to private businesses, productivity increased.
China was also positioned as a cheap manufacturing hub for multinational corporations. Since rising into contention, the country has become the world’s largest exporter.
India held the title of the sixth largest economy in 2020. Similar to China, the country’s growth came from relaxed economic restrictions, and it has seen particularly strong growth within the service sector, including telecommunications, IT, and software.
With dynamics shifting, which countries will be on the leaderboard in another 25 years?

This article was published as a part of Visual Capitalist's Creator Program, which features data-driven visuals from some of our favorite Creators around the world.


Markets
Mapped: Europe’s GDP Per Capita, by Country
Which European economies are richest on a GDP per capita basis? This map shows the results for 44 countries across the continent.


Mapped: Europe’s GDP Per Capita, by Country (2024)
This was originally posted on our Voronoi app. Download the app for free on iOS or Android and discover incredible data-driven charts from a variety of trusted sources.
Europe is home to some of the largest and most sophisticated economies in the world. But how do countries in the region compare with each other on a per capita productivity basis?
In this map, we show Europe’s GDP per capita levels across 44 nations in current U.S. dollars. Data for this visualization and article is sourced from the International Monetary Fund (IMF) via their DataMapper tool, updated April 2024.
Europe’s Richest and Poorest Nations, By GDP Per Capita
Luxembourg, Ireland, and Switzerland, lead the list of Europe’s richest nations by GDP per capita, all above $100,000.
| Rank | Country | GDP Per Capita (2024) |
|---|---|---|
| 1 | 🇱🇺 Luxembourg | $131,380 |
| 2 | 🇮🇪 Ireland | $106,060 |
| 3 | 🇨🇭 Switzerland | $105,670 |
| 4 | 🇳🇴 Norway | $94,660 |
| 5 | 🇮🇸 Iceland | $84,590 |
| 6 | 🇩🇰 Denmark | $68,900 |
| 7 | 🇳🇱 Netherlands | $63,750 |
| 8 | 🇸🇲 San Marino | $59,410 |
| 9 | 🇦🇹 Austria | $59,230 |
| 10 | 🇸🇪 Sweden | $58,530 |
| 11 | 🇧🇪 Belgium | $55,540 |
| 12 | 🇫🇮 Finland | $55,130 |
| 13 | 🇩🇪 Germany | $54,290 |
| 14 | 🇬🇧 UK | $51,070 |
| 15 | 🇫🇷 France | $47,360 |
| 16 | 🇦🇩 Andorra | $44,900 |
| 17 | 🇲🇹 Malta | $41,740 |
| 18 | 🇮🇹 Italy | $39,580 |
| 19 | 🇨🇾 Cyprus | $37,150 |
| 20 | 🇪🇸 Spain | $34,050 |
| 21 | 🇸🇮 Slovenia | $34,030 |
| 22 | 🇪🇪 Estonia | $31,850 |
| 23 | 🇨🇿 Czech Republic | $29,800 |
| 24 | 🇵🇹 Portugal | $28,970 |
| 25 | 🇱🇹 Lithuania | $28,410 |
| 26 | 🇸🇰 Slovakia | $25,930 |
| 27 | 🇱🇻 Latvia | $24,190 |
| 28 | 🇬🇷 Greece | $23,970 |
| 29 | 🇭🇺 Hungary | $23,320 |
| 30 | 🇵🇱 Poland | $23,010 |
| 31 | 🇭🇷 Croatia | $22,970 |
| 32 | 🇷🇴 Romania | $19,530 |
| 33 | 🇧🇬 Bulgaria | $16,940 |
| 34 | 🇷🇺 Russia | $14,390 |
| 35 | 🇹🇷 Türkiye | $12,760 |
| 36 | 🇲🇪 Montenegro | $12,650 |
| 37 | 🇷🇸 Serbia | $12,380 |
| 38 | 🇦🇱 Albania | $8,920 |
| 39 | 🇧🇦 Bosnia & Herzegovina | $8,420 |
| 40 | 🇲🇰 North Macedonia | $7,690 |
| 41 | 🇧🇾 Belarus | $7,560 |
| 42 | 🇲🇩 Moldova | $7,490 |
| 43 | 🇽🇰 Kosovo | $6,390 |
| 44 | 🇺🇦 Ukraine | $5,660 |
| N/A | 🇪🇺 EU Average | $44,200 |
Note: Figures are rounded.
Three Nordic countries (Norway, Iceland, Denmark) also place highly, between $70,000-90,000. Other Nordic peers, Sweden and Finland rank just outside the top 10, between $55,000-60,000.
Meanwhile, Europe’s biggest economies in absolute terms, Germany, UK, and France, rank closer to the middle of the top 20, with GDP per capitas around $50,000.
Finally, at the end of the scale, Eastern Europe as a whole tends to have much lower per capita GDPs. In that group, Ukraine ranks last, at $5,660.
A Closer Look at Ukraine
For a broader comparison, Ukraine’s per capita GDP is similar to Iran ($5,310), El Salvador ($5,540), and Guatemala ($5,680).
According to experts, Ukraine’s economy has historically underperformed to expectations. After the fall of the Berlin Wall, the economy contracted for five straight years. Its transition to a Western, liberalized economic structure was overshadowed by widespread corruption, a limited taxpool, and few revenue sources.
Politically, its transformation from authoritarian regime to civil democracy has proved difficult, especially when it comes to institution building.
Finally, after the 2022 invasion of the country, Ukraine’s GDP contracted by 30% in a single year—the largest loss since independence. Large scale emigration—to the tune of six million refugees—is also playing a role.
Despite these challenges, the country’s economic growth has somewhat stabilized while fighting continues.

-

 Markets6 days ago
Visualized: Interest Rate Forecasts for Advanced Economies
-

 Economy2 weeks ago
Economic Growth Forecasts for G7 and BRICS Countries in 2024
-

 Wealth2 weeks ago
Charted: Which City Has the Most Billionaires in 2024?
-

 Technology2 weeks ago
All of the Grants Given by the U.S. CHIPS Act
-

 Green2 weeks ago
The Carbon Footprint of Major Travel Methods
-

 United States1 week ago
Visualizing the Most Common Pets in the U.S.
-

 Culture1 week ago
The World’s Top Media Franchises by All-Time Revenue
-

 Best of1 week ago
Best Visualizations of April on the Voronoi App