Markets
This Chart Shows How Different Generations Would Invest $10,000
How Different Generations Would Invest $10,000
The Chart of the Week is a weekly Visual Capitalist feature on Fridays.
If someone slipped you a $10,000 check and told you to invest it, what would you do with the money?
With no strings attached, there is a wide variety of ways that you could deploy that cash.
You could look at it as a one-time windfall that could shore up your personal balance sheet, or you could go at it much more aggressively. It’s money that you didn’t expect to receive, so why not throw it at high-risk, high-reward assets?
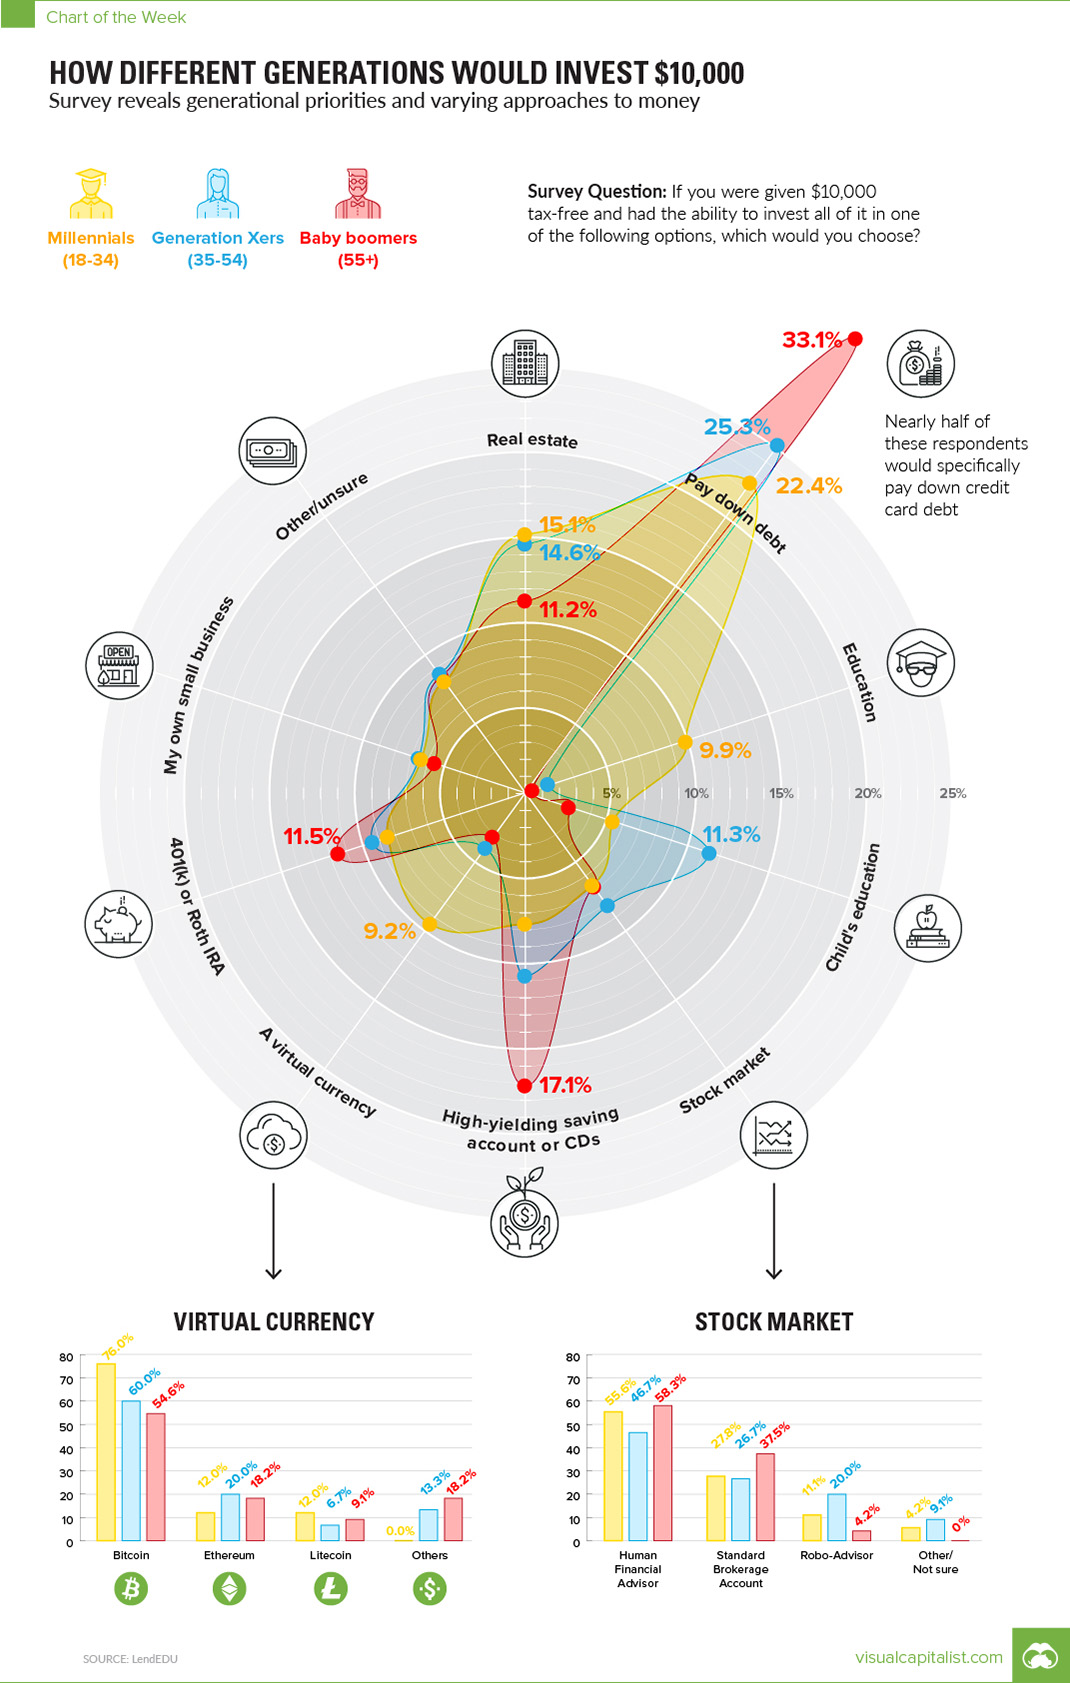
How to Invest $10k?
Today’s chart is based on a survey from LendEDU, which posed this exact question to 1,000 Americans in March 2018:
Question: If you were given $10,000 tax-free and had the ability to invest all of it in one of the following options, which would you choose?
Here are the results of the sample as a whole:
| How to Invest $10K? | % of Respondents |
|---|---|
| Pay down debt | 27.3% |
| Real estate | 13.5% |
| Savings account or CDs | 12.2% |
| 401(k) or Roth IRA | 9.9% |
| Stock market | 7.2% |
| Child's education | 6.9% |
| Small business | 6.2% |
| Virtual currency | 5.1% |
| Education | 3.2% |
| Other/Unsure | 8.5% |
Note: We’ve made slight adjustments to the original answers, combining one low-performing category (P2P loans) into the “Other” category
Paying down debt (27.3%) was by far the most popular response. It’s also interesting to see that many people would opt to put the $10k towards their own small business, education, or even digital currencies like Bitcoin, Ethereum, or Litecoin.
Now, here’s the same data grouped together by generations:
| How to Invest $10K? | Millenials (18-34) | Gen X (35-54) | Boomers (55+) |
|---|---|---|---|
| Pay down debt | 22.4% | 25.3% | 33.1% |
| Real estate | 15.1% | 14.6% | 11.2% |
| Education | 9.9% | 1.1% | 0.3% |
| Virtual currency | 9.2% | 4.0% | 3.1% |
| 401(k) or Roth IRA | 8.5% | 9.4% | 11.5% |
| Other/Unsure | 8.1% | 8.6% | 8.7% |
| Savings account or CDs | 7.7% | 10.8% | 17.1% |
| Stock market | 6.6% | 8.1% | 6.7% |
| Child's education | 6.3% | 11.3% | 2.8% |
| Small business | 6.3% | 6.7% | 5.6% |
Interestingly, certain answers had the same popularity across the board for all generations.
All groups were equally interested in investing in their small businesses. The highest response here came from Gen X at 6.7%, but Millennials and Gen X weren’t far off at 6.3% and 5.6% respectively.
In addition, investing in the stock market was pretty consistent as well, with Millennials at 6.6%, Generation X at 8.1%, and Boomers at 6.7%. All these groups were mostly interested in doing this through a human financial advisor, though Gen X gave robo-advisors a higher rate of consideration (20%) than other generations (11% Millennials, 4% Boomers)
Generational Differences
Some generational differences are as to be expected. For instance, barely any Baby Boomers (0.3%) wanted to put $10,000 towards their own education. This makes sense, since many are at or near retirement already. On the other hand, 9.9% of Millennials opted for an investment in education.
But here’s a situation that might be a bit more peculiar. One would guess that with student debt being at $1.5 trillion in the United States, many Millennials would opt to pay down debt with their $10,000 check. Interestingly, fewer Millennials (22.4%) chose to pay down debt than either Gen X (25.3%) or Boomers (33.1%).
On the same token, Millennials were more likely to choose either real estate (15.1%) or cryptocurrency (9.2%) as an investment. For contrast, look at Boomers, a group that had 11.2% choose real estate and only 3.1% choose crypto.


Markets
The European Stock Market: Attractive Valuations Offer Opportunities
On average, the European stock market has valuations that are nearly 50% lower than U.S. valuations. But how can you access the market?


European Stock Market: Attractive Valuations Offer Opportunities
Europe is known for some established brands, from L’Oréal to Louis Vuitton. However, the European stock market offers additional opportunities that may be lesser known.
The above infographic, sponsored by STOXX, outlines why investors may want to consider European stocks.
Attractive Valuations
Compared to most North American and Asian markets, European stocks offer lower or comparable valuations.
| Index | Price-to-Earnings Ratio | Price-to-Book Ratio |
|---|---|---|
| EURO STOXX 50 | 14.9 | 2.2 |
| STOXX Europe 600 | 14.4 | 2 |
| U.S. | 25.9 | 4.7 |
| Canada | 16.1 | 1.8 |
| Japan | 15.4 | 1.6 |
| Asia Pacific ex. China | 17.1 | 1.8 |
Data as of February 29, 2024. See graphic for full index names. Ratios based on trailing 12 month financials. The price to earnings ratio excludes companies with negative earnings.
On average, European valuations are nearly 50% lower than U.S. valuations, potentially offering an affordable entry point for investors.
Research also shows that lower price ratios have historically led to higher long-term returns.
Market Movements Not Closely Connected
Over the last decade, the European stock market had low-to-moderate correlation with North American and Asian equities.
The below chart shows correlations from February 2014 to February 2024. A value closer to zero indicates low correlation, while a value of one would indicate that two regions are moving in perfect unison.
| EURO STOXX 50 | STOXX EUROPE 600 | U.S. | Canada | Japan | Asia Pacific ex. China |
|
|---|---|---|---|---|---|---|
| EURO STOXX 50 | 1.00 | 0.97 | 0.55 | 0.67 | 0.24 | 0.43 |
| STOXX EUROPE 600 | 1.00 | 0.56 | 0.71 | 0.28 | 0.48 | |
| U.S. | 1.00 | 0.73 | 0.12 | 0.25 | ||
| Canada | 1.00 | 0.22 | 0.40 | |||
| Japan | 1.00 | 0.88 | ||||
| Asia Pacific ex. China | 1.00 |
Data is based on daily USD returns.
European equities had relatively independent market movements from North American and Asian markets. One contributing factor could be the differing sector weights in each market. For instance, technology makes up a quarter of the U.S. market, but health care and industrials dominate the broader European market.
Ultimately, European equities can enhance portfolio diversification and have the potential to mitigate risk for investors.
Tracking the Market
For investors interested in European equities, STOXX offers a variety of flagship indices:
| Index | Description | Market Cap |
|---|---|---|
| STOXX Europe 600 | Pan-regional, broad market | €10.5T |
| STOXX Developed Europe | Pan-regional, broad-market | €9.9T |
| STOXX Europe 600 ESG-X | Pan-regional, broad market, sustainability focus | €9.7T |
| STOXX Europe 50 | Pan-regional, blue-chip | €5.1T |
| EURO STOXX 50 | Eurozone, blue-chip | €3.5T |
Data is as of February 29, 2024. Market cap is free float, which represents the shares that are readily available for public trading on stock exchanges.
The EURO STOXX 50 tracks the Eurozone’s biggest and most traded companies. It also underlies one of the world’s largest ranges of ETFs and mutual funds. As of November 2023, there were €27.3 billion in ETFs and €23.5B in mutual fund assets under management tracking the index.
“For the past 25 years, the EURO STOXX 50 has served as an accurate, reliable and tradable representation of the Eurozone equity market.”
— Axel Lomholt, General Manager at STOXX
Partnering with STOXX to Track the European Stock Market
Are you interested in European equities? STOXX can be a valuable partner:
- Comprehensive, liquid and investable ecosystem
- European heritage, global reach
- Highly sophisticated customization capabilities
- Open architecture approach to using data
- Close partnerships with clients
- Part of ISS STOXX and Deutsche Börse Group
With a full suite of indices, STOXX can help you benchmark against the European stock market.
Learn how STOXX’s European indices offer liquid and effective market access.

-

 Economy2 days ago
Economic Growth Forecasts for G7 and BRICS Countries in 2024
The IMF has released its economic growth forecasts for 2024. How do the G7 and BRICS countries compare?
-

 Markets1 week ago
U.S. Debt Interest Payments Reach $1 Trillion
U.S. debt interest payments have surged past the $1 trillion dollar mark, amid high interest rates and an ever-expanding debt burden.
-

 United States2 weeks ago
Ranked: The Largest U.S. Corporations by Number of Employees
We visualized the top U.S. companies by employees, revealing the massive scale of retailers like Walmart, Target, and Home Depot.
-

 Markets2 weeks ago
The Top 10 States by Real GDP Growth in 2023
This graphic shows the states with the highest real GDP growth rate in 2023, largely propelled by the oil and gas boom.
-

 Markets2 weeks ago
Ranked: The World’s Top Flight Routes, by Revenue
In this graphic, we show the highest earning flight routes globally as air travel continued to rebound in 2023.
-

 Markets3 weeks ago
Ranked: The Most Valuable Housing Markets in America
The U.S. residential real estate market is worth a staggering $47.5 trillion. Here are the most valuable housing markets in the country.


-

 Education1 week ago
How Hard Is It to Get Into an Ivy League School?
-

 Technology2 weeks ago
Ranked: Semiconductor Companies by Industry Revenue Share
-
Markets2 weeks ago
Ranked: The World’s Top Flight Routes, by Revenue
-

 Demographics2 weeks ago
Population Projections: The World’s 6 Largest Countries in 2075
-
Markets2 weeks ago
The Top 10 States by Real GDP Growth in 2023
-

 Demographics2 weeks ago
The Smallest Gender Wage Gaps in OECD Countries
-

 Economy2 weeks ago
Where U.S. Inflation Hit the Hardest in March 2024
-

 Green2 weeks ago
Top Countries By Forest Growth Since 2001