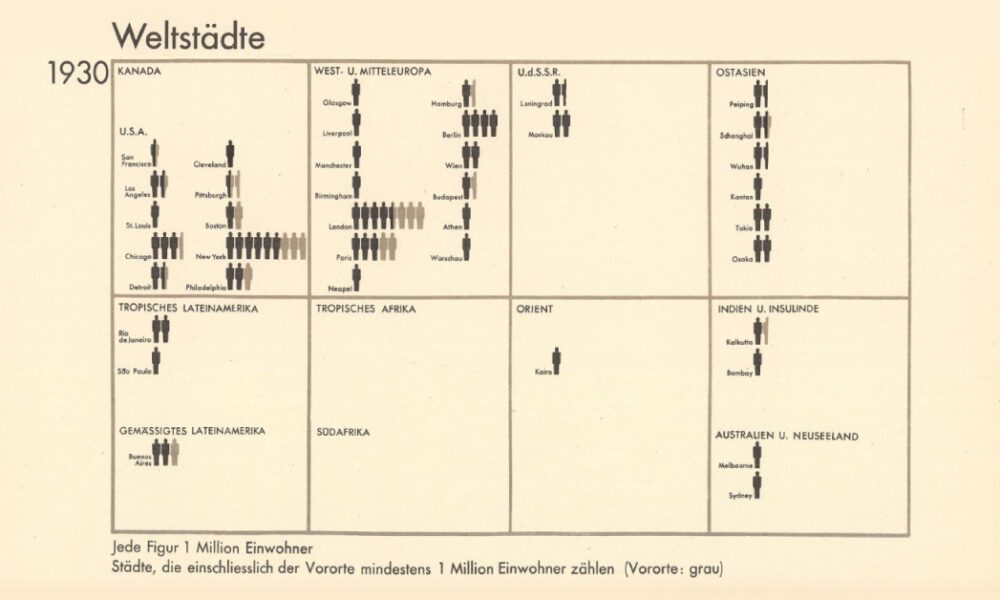
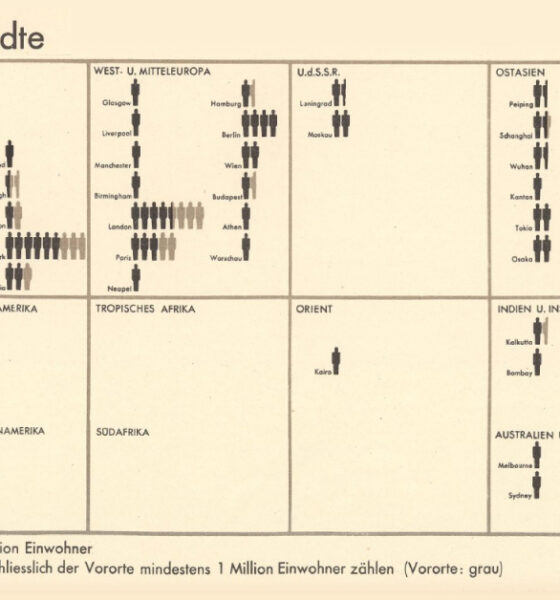
From someone born in the 19th century, in the midst of historic population growth, comes this vintage visualization showing world...
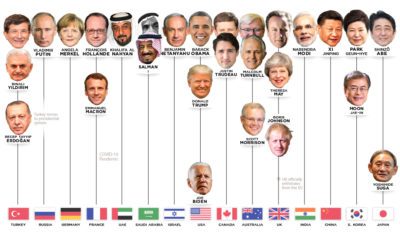

Who has led the world's 15 most powerful countries over the last 50 years? This visual looks at world leaders from 1970 to today.
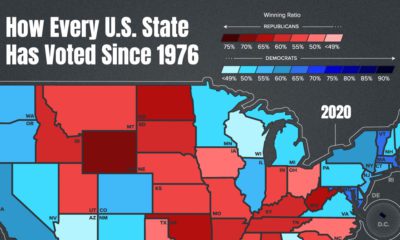

With this map of U.S. presidential voting history by state, discover patterns that have emerged over the last twelve elections.


By embracing uncertainty and making timely pivots, we visualize the bizarre origin stories of the most successful tech companies today.
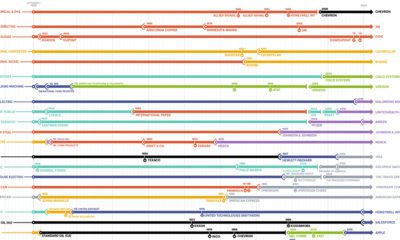

The Dow Jones Industrial Average is constantly evolving. This chart tracks which companies have come and gone since the inception of the index in 1928.


A lot can happen in an internet minute. This graphic looks at the enormous numbers behind the online services billions use every day.
Ammonium nitrate is dangerous, and every few years, there's a new explosion that causes widespread damage. These are some of the biggest ones.
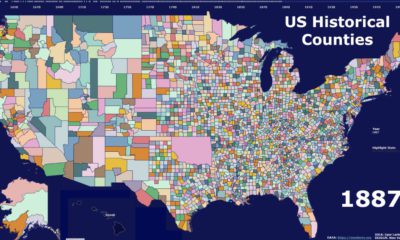

This video highlights the history of American counties, and how their boundaries have changed over the last 300 years.
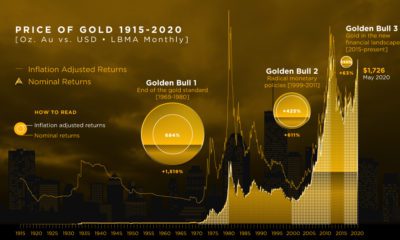

We break down gold's three major bull markets over the last century. This includes the current one, in which gold has hit 8-year highs.
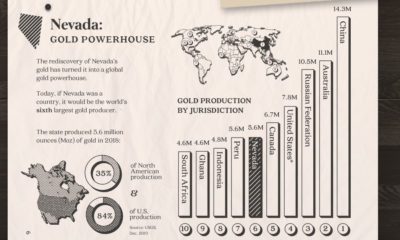

Nevada accounts for 84% of U.S. gold production today. Here's a look at the state's rich history, its prolific production, and what the future may hold.
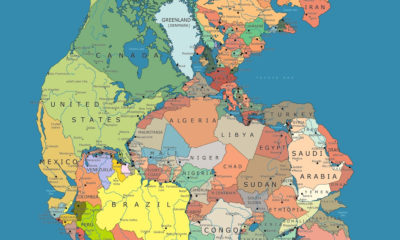

Many millions of years ago, the world was one. This nifty map shows this Pangea supercontinent overlaid with modern country borders.


