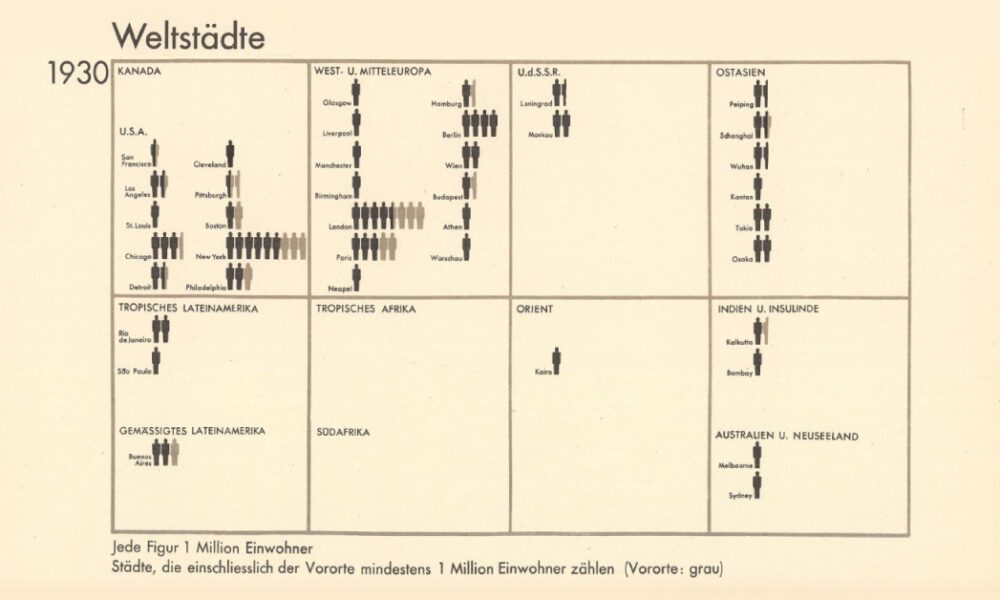
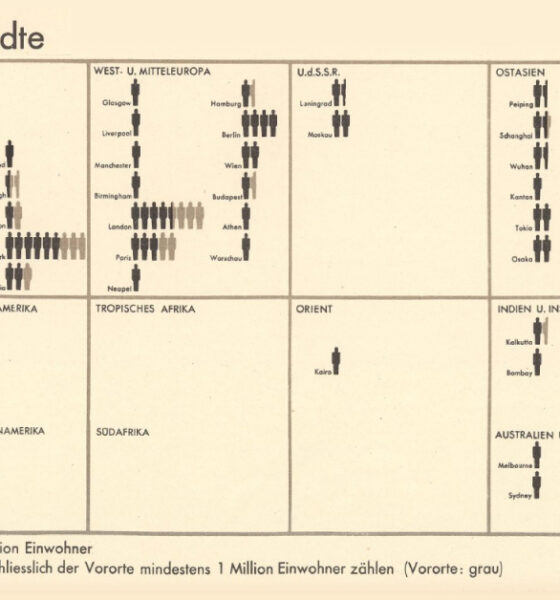
From someone born in the 19th century, in the midst of historic population growth, comes this vintage visualization showing world...


Just how powerful are nuclear bombs? Here's a look at the top 10 largest nuclear explosions.
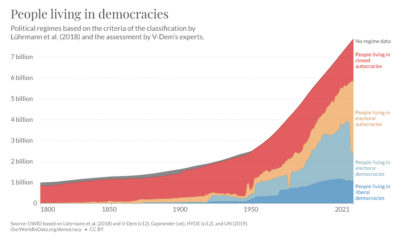

Are political democracies on the decline? This graphic shows the global composition of political regimes over 200 years.
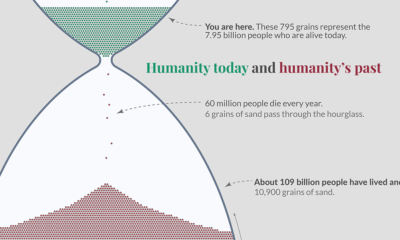

This impactful hour glass visualization shows all of humanity, including the 7% of humans who are alive today
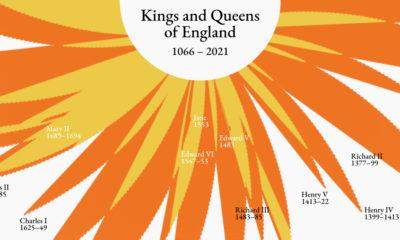

Who sat on the throne and for how long? This visualization highlights the reigns of England’s kings and queens from 1066 to present day.
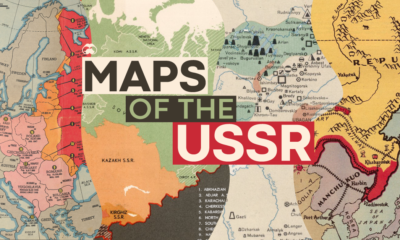

These historical maps tell the story of the USSR, and how its territorial expansion and contraction is linked to present day geopolitical events.
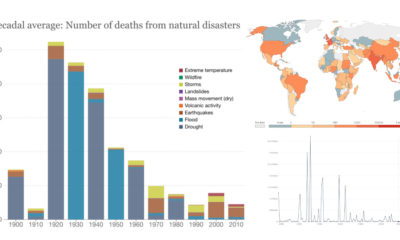

This interactive dashboard, which covers over a century of data on natural disasters, shows a declining global death toll over time.


The Greek alphabet is just one part of the modern alphabet’s long evolution.
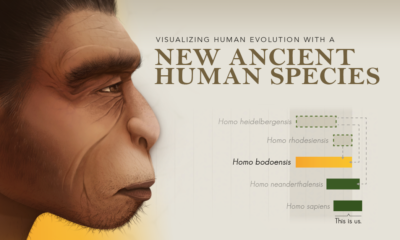

We visualize changes to our understanding of human evolution with the introduction of a new ancient human species, Homo bodoensis.
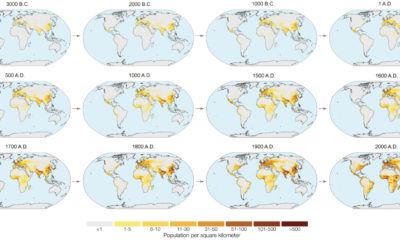

In the next year or so, humanity is expected to pass the 8 billion person milestone. These charts and maps put global population growth into context.
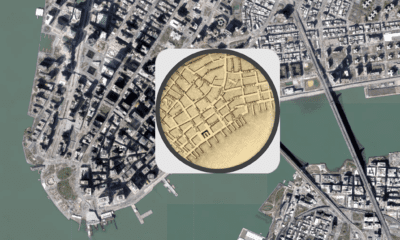

The early 1800s were a time of rapid change in New York City. This map shows the city in 1836, alongside the modern day metropolis.


 Creator Program