Maps
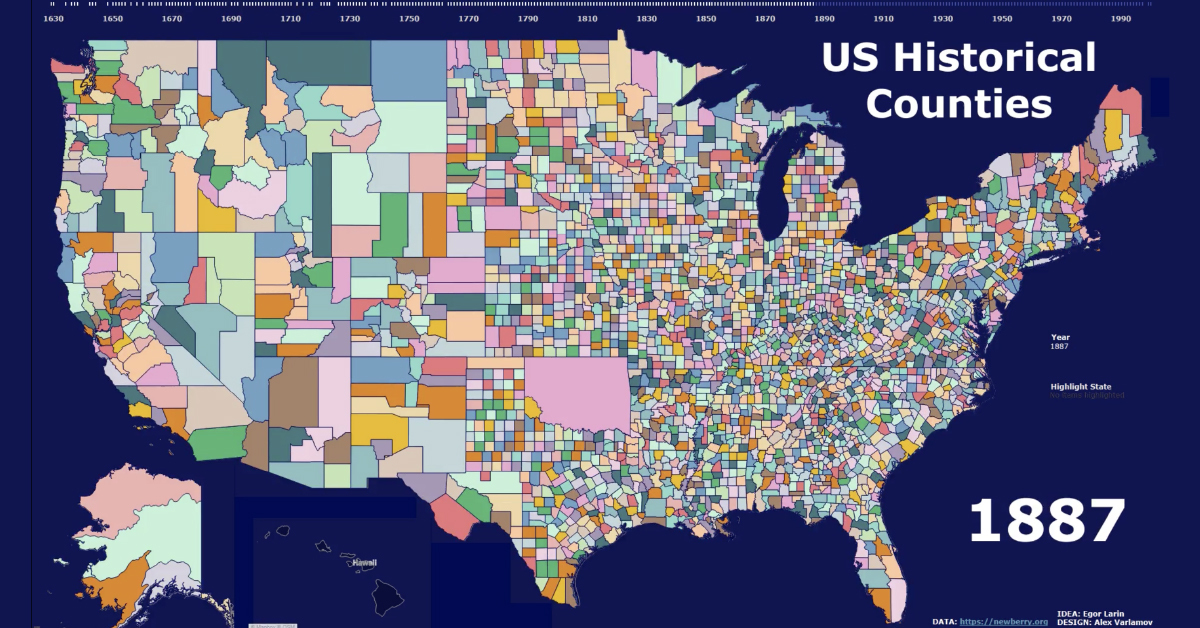
Animated Map: The History of U.S. Counties
Animated Video: The History of U.S Counties
Did you know that there are 3,142 different counties in the U.S. today?
Going as far back as the 1600s, English settlers arriving in the New World envisioned counties as a means of accessible government—a county seat was meant to be within a day’s buggy ride for every citizen.
While the role of counties in local government has remained significant in modern times, their boundaries have changed drastically over the years.
This animated map by Alexander Varlamov visualizes the history of U.S. county borders, and how these jurisdictions have evolved over time.
County Equivalents
Before diving in, it’s important to note a few county-equivalents that function similarly but go by different names:
- Boroughs/Census areas: Alaska is made up of 19 boroughs, but the majority of its landmass is not included in them. Rather, it’s officially labeled by the Alaskan government as the unorganized borough.
- Parishes: Instead of counties, Louisiana uses the term parishes because of its French and Catholic heritage.
- Independent cities: These are cities that operate outside their surrounding county’s jurisdiction. There are 41 independent cities in the U.S. and 38 of them are in Virginia.
Over 300 Years of Growth
The number of counties in the U.S. has increased dramatically since the early days of American history. Here’s a look at their growth since 1790:
| Year | Number of Counties and Parishes |
|---|---|
| 1790 | 292 |
| 1850 | 1621 |
| 1870 | 2247 |
| 1900 | 2713 |
| 1920 | 3041 |
The first county was established in 1634, over 100 years before the first Census was taken (and long before America gained independence). It was created in James City, Virginia—an interesting location, considering Virginia now has the highest concentration of independent cities.
Why does Virginia have so many independent cities? The state’s separation of counties and cities dates back to the early 1700s. With a rural population and low productivity, it was difficult to establish town centers. After several attempts, the General Assembly gave up. Independent cities were established instead.
Short-lived Counties
Counties as a political organization have been around for hundreds of years, but some individual counties haven’t lasted long.
For instance, Bullfrog County in Nevada was established in 1987 and dissolved just two years later. During its brief existence, it had no population and no infrastructure—and its primary purpose was simply to prevent Yucca Mountain from becoming a nuclear waste dump.
While Bullfrog County has since been dissolved, the controversy around the nuclear waste site is ongoing as of 2020.
Continual Change
The latest official county, Broomfield Country, was established in Colorado in 2001.
Although it’s been decades since the last county was created, there have been continual boundary changes and status updates—sometimes for political reasons. For instance, the Supreme Court recently ruled that half of Oklahoma is within a Native American reservation. While this doesn’t necessarily change ownership, it does affect jurisdiction and county authority.
Though the lines on the map are more or less static now, the invisible lines of county jurisdiction will continue to change and evolve over time.


Maps
The Largest Earthquakes in the New York Area (1970-2024)
The earthquake that shook buildings across New York in April 2024 was the third-largest quake in the Northeast U.S. over the past 50 years.


The Largest Earthquakes in the New York Area
This was originally posted on our Voronoi app. Download the app for free on Apple or Android and discover incredible data-driven charts from a variety of trusted sources.
The 4.8 magnitude earthquake that shook buildings across New York on Friday, April 5th, 2024 was the third-largest quake in the U.S. Northeast area over the past 50 years.
In this map, we illustrate earthquakes with a magnitude of 4.0 or greater recorded in the Northeastern U.S. since 1970, according to the United States Geological Survey (USGS).
Shallow Quakes and Older Buildings
The earthquake that struck the U.S. Northeast in April 2024 was felt by millions of people from Washington, D.C., to north of Boston. It even caused a full ground stop at Newark Airport.
The quake, occurring just 5 km beneath the Earth’s surface, was considered shallow, which is what contributed to more intense shaking at the surface.
According to the USGS, rocks in the eastern U.S. are significantly older, denser, and harder than those on the western side, compressed by time. This makes them more efficient conduits for seismic energy. Additionally, buildings in the Northeast tend to be older and may not adhere to the latest earthquake codes.
Despite disrupting work and school life, the earthquake was considered minor, according to the Michigan Technological University magnitude scale:
| Magnitude | Earthquake Effects | Estimated Number Each Year |
|---|---|---|
| 2.5 or less | Usually not felt, but can be recorded by seismograph. | Millions |
| 2.5 to 5.4 | Often felt, but only causes minor damage. | 500,000 |
| 5.5 to 6.0 | Slight damage to buildings and other structures. | 350 |
| 6.1 to 6.9 | May cause a lot of damage in very populated areas. | 100 |
| 7.0 to 7.9 | Major earthquake. Serious damage. | 10-15 |
| 8.0 or greater | Great earthquake. Can totally destroy communities near the epicenter. | One every year or two |
The largest earthquake felt in the area over the past 50 years was a 5.3 magnitude quake that occurred in Au Sable Forks, New York, in 2002. It damaged houses and cracked roads in a remote corner of the Adirondack Mountains, but caused no injuries.
| Date | Magnitude | Location | State |
|---|---|---|---|
| April 20, 2002 | 5.3 | Au Sable Forks | New York |
| October 7, 1983 | 5.1 | Newcomb | New York |
| April 5, 2024 | 4.8 | Whitehouse Station | New Jersey |
| October 16, 2012 | 4.7 | Hollis Center | Maine |
| January 16, 1994 | 4.6 | Sinking Spring | Pennsylvania |
| January 19, 1982 | 4.5 | Sanbornton | New Hampshire |
| September 25, 1998 | 4.5 | Adamsville | Pennsylvania |
| June 9, 1975 | 4.2 | Altona | New York |
| May 29, 1983 | 4.2 | Peru | Maine |
| April 23, 1984 | 4.2 | Conestoga | Pennsylvania |
| January 16, 1994 | 4.2 | Sinking Spring | Pennsylvania |
| November 3, 1975 | 4 | Long Lake | New York |
| June 17, 1991 | 4 | Worcester | New York |
The largest earthquake in U.S. history, however, was the 1964 Good Friday quake in Alaska, measuring 9.2 magnitude and killing 131 people.

-

 Education1 week ago
How Hard Is It to Get Into an Ivy League School?
-

 Technology2 weeks ago
Ranked: Semiconductor Companies by Industry Revenue Share
-

 Markets2 weeks ago
Ranked: The World’s Top Flight Routes, by Revenue
-

 Demographics2 weeks ago
Population Projections: The World’s 6 Largest Countries in 2075
-

 Markets2 weeks ago
The Top 10 States by Real GDP Growth in 2023
-

 Demographics2 weeks ago
The Smallest Gender Wage Gaps in OECD Countries
-

 Economy2 weeks ago
Where U.S. Inflation Hit the Hardest in March 2024
-

 Green2 weeks ago
Top Countries By Forest Growth Since 2001