Maps
Charted: The Number of North Korean Defectors (1998-2023)
Why Are the Number of North Korean Defectors Decreasing?
North Korea, formally known as the Democratic People’s Republic of Korea, is a totalitarian dictatorship with extremely limited freedoms and rights reported for its citizens.
Due to the country’s tight controls on borders and information, people that want to leave the country often have to physically escape and are known as defectors.
These visuals use data from the South Korea’s Ministry of Reunification to track the number of North Korean defectors who make it to South Korea each year, as well as international reporting to explain the dwindling numbers.
North Korean Defectors from 1998–2023
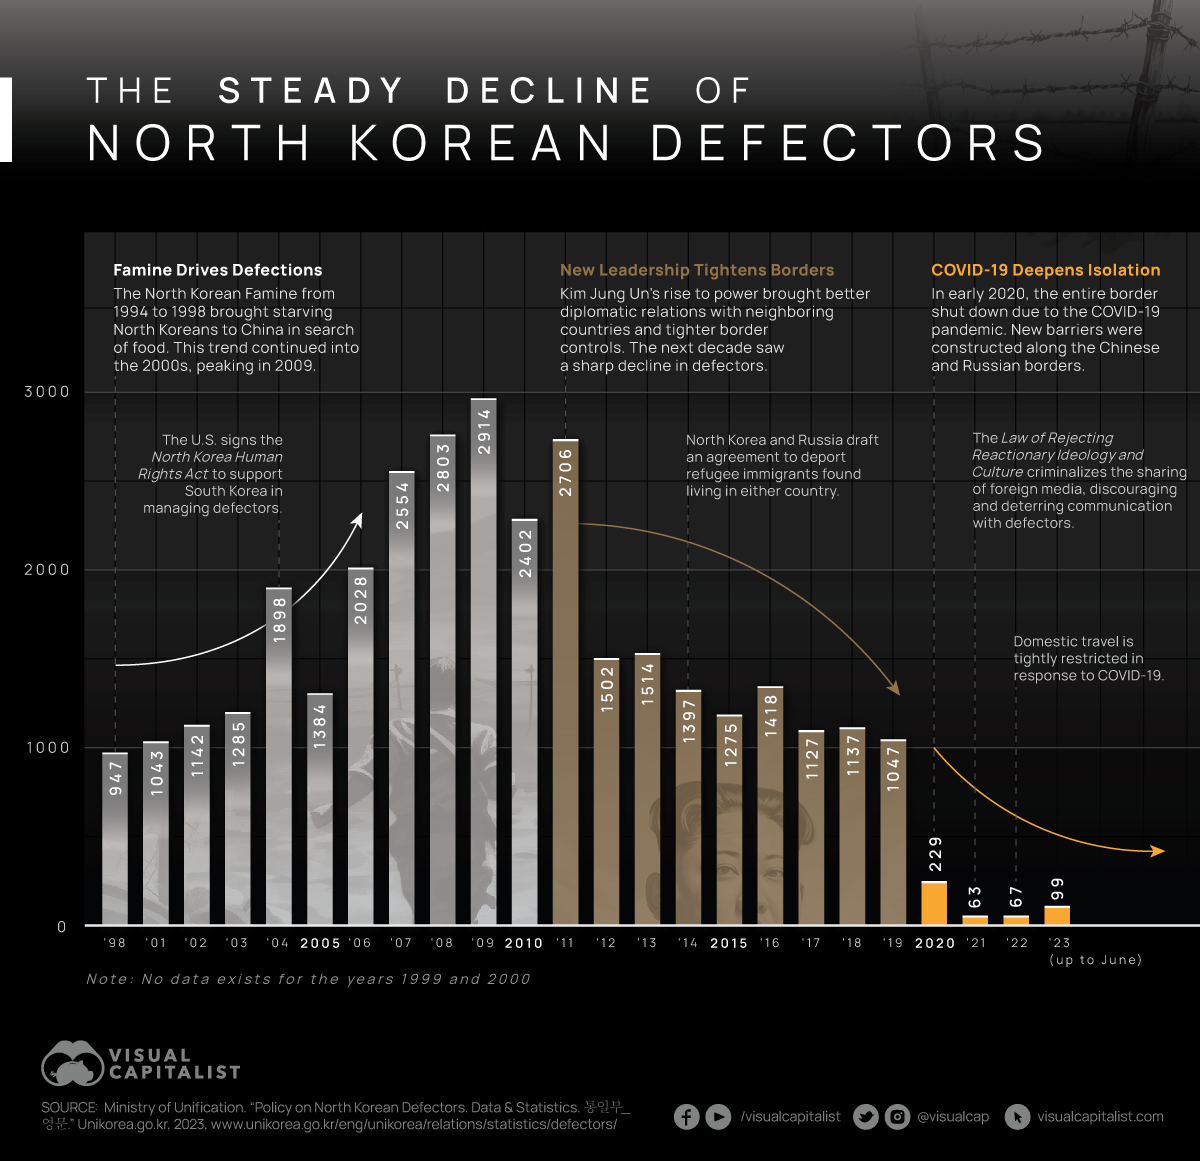
The table below shows the amount of successful North Korean defectors that arrived in South Korea from 1998 through to June of 2023. Note that there was no data available for 1999 and 2000.
| Year | North Korean Defectors |
|---|---|
| 1998 | 947 |
| 1999 | N/A |
| 2000 | N/A |
| 2001 | 1,043 |
| 2002 | 1,142 |
| 2003 | 1,285 |
| 2004 | 1,898 |
| 2005 | 1,384 |
| 2006 | 2,028 |
| 2007 | 2,554 |
| 2008 | 2,803 |
| 2009 | 2,914 |
| 2010 | 2,402 |
| 2011 | 2,706 |
| 2012 | 1,502 |
| 2013 | 1,514 |
| 2014 | 1,397 |
| 2015 | 1,275 |
| 2016 | 1,418 |
| 2017 | 1,127 |
| 2018 | 1,137 |
| 2019 | 1,047 |
| 2020 | 229 |
| 2021 | 63 |
| 2022 | 67 |
| 2023 (as of June) | 99 |
From the 1990s to 2010, we can see the amount of North Korean defectors steadily climbing to a peak of 2,914 people in 2009 alone.
More residents looked to escape the country after suffering through the North Korean Famine of 1994 to 1998—with death estimates ranging from 240,000 to 3,500,000—as well as the country’s increasingly bleak economic conditions following the collapse of the neighboring Soviet Union.
We can also see the immediate impact of Kim Jung Un’s rise to power since 2012, with successful defections immediately dropping by 1,204 year-over-year and declining consistently over the next decade. Stronger border controls were one factor, as were improved relations with China and agreements with Russia on sending escapees back to North Korea.
And North Korea has seen defections drop further, from thousands to low hundreds, since 2020. Following the COVID-19 pandemic, the country shut down all borders, created new barriers, and significantly limited internal travel.
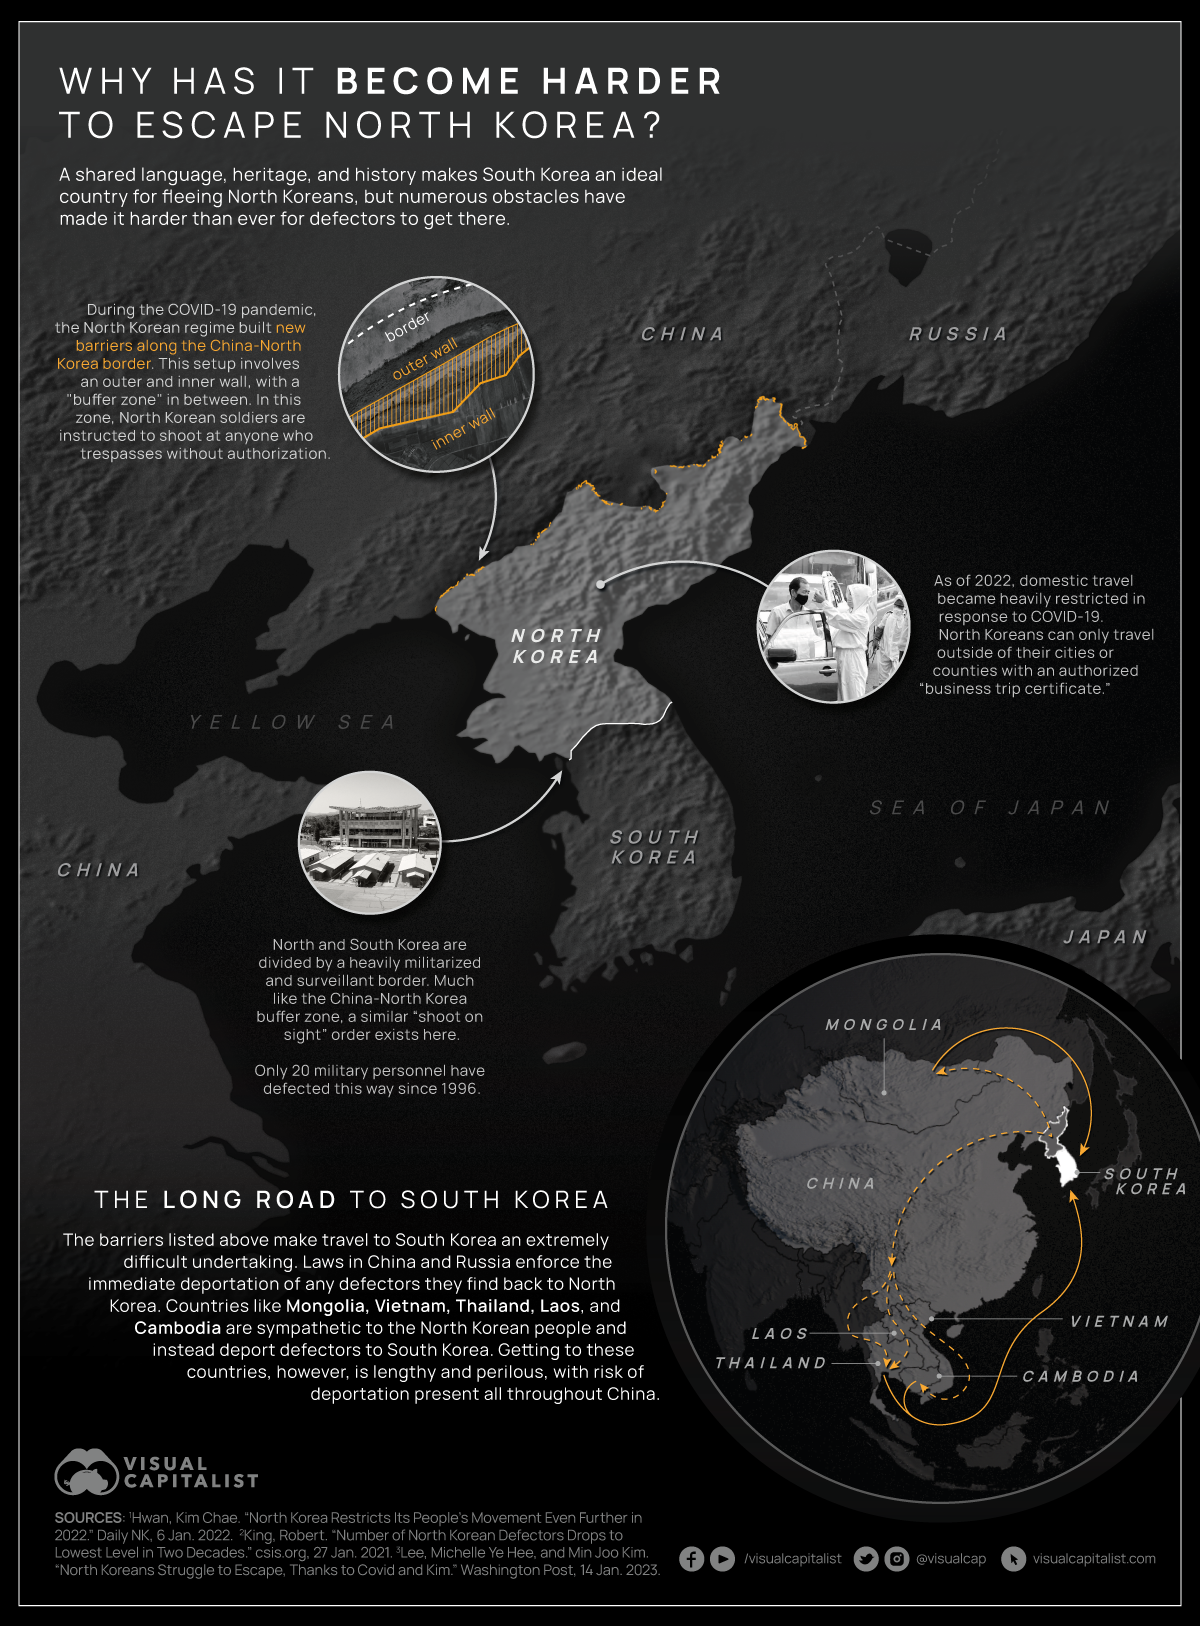
Mapping Escape Routes from North Korea
Click here to see a larger version of the graphic above.
Since they can’t cross the heavily surveilled and militarized border to South Korea, the Korean Demilitarized Zone, North Korean defectors have to travel through Russia or China to get to friendly countries in order to seek asylum.
For most defectors, these include reaching Mongolia to the north or Cambodia, Laos, Thailand, and Vietnam to the south, which all work with the South Korean government on reunification.
There are also defectors that try to stay in Russia or China. In 2009, a global refugee survey found there were 11,000 North Korean refugees hiding in China close to the North Korea border alone, not accounting for the rest of the country.
Others are able to seek refuge in other countries and eventually attain citizenship. In 2022, the UNHCR registered 260 refugees and 127 asylees from North Korea, with Germany hosting the most at 96 and the U.S. second at 70.


Maps
The Largest Earthquakes in the New York Area (1970-2024)
The earthquake that shook buildings across New York in April 2024 was the third-largest quake in the Northeast U.S. over the past 50 years.


The Largest Earthquakes in the New York Area
This was originally posted on our Voronoi app. Download the app for free on Apple or Android and discover incredible data-driven charts from a variety of trusted sources.
The 4.8 magnitude earthquake that shook buildings across New York on Friday, April 5th, 2024 was the third-largest quake in the U.S. Northeast area over the past 50 years.
In this map, we illustrate earthquakes with a magnitude of 4.0 or greater recorded in the Northeastern U.S. since 1970, according to the United States Geological Survey (USGS).
Shallow Quakes and Older Buildings
The earthquake that struck the U.S. Northeast in April 2024 was felt by millions of people from Washington, D.C., to north of Boston. It even caused a full ground stop at Newark Airport.
The quake, occurring just 5 km beneath the Earth’s surface, was considered shallow, which is what contributed to more intense shaking at the surface.
According to the USGS, rocks in the eastern U.S. are significantly older, denser, and harder than those on the western side, compressed by time. This makes them more efficient conduits for seismic energy. Additionally, buildings in the Northeast tend to be older and may not adhere to the latest earthquake codes.
Despite disrupting work and school life, the earthquake was considered minor, according to the Michigan Technological University magnitude scale:
| Magnitude | Earthquake Effects | Estimated Number Each Year |
|---|---|---|
| 2.5 or less | Usually not felt, but can be recorded by seismograph. | Millions |
| 2.5 to 5.4 | Often felt, but only causes minor damage. | 500,000 |
| 5.5 to 6.0 | Slight damage to buildings and other structures. | 350 |
| 6.1 to 6.9 | May cause a lot of damage in very populated areas. | 100 |
| 7.0 to 7.9 | Major earthquake. Serious damage. | 10-15 |
| 8.0 or greater | Great earthquake. Can totally destroy communities near the epicenter. | One every year or two |
The largest earthquake felt in the area over the past 50 years was a 5.3 magnitude quake that occurred in Au Sable Forks, New York, in 2002. It damaged houses and cracked roads in a remote corner of the Adirondack Mountains, but caused no injuries.
| Date | Magnitude | Location | State |
|---|---|---|---|
| April 20, 2002 | 5.3 | Au Sable Forks | New York |
| October 7, 1983 | 5.1 | Newcomb | New York |
| April 5, 2024 | 4.8 | Whitehouse Station | New Jersey |
| October 16, 2012 | 4.7 | Hollis Center | Maine |
| January 16, 1994 | 4.6 | Sinking Spring | Pennsylvania |
| January 19, 1982 | 4.5 | Sanbornton | New Hampshire |
| September 25, 1998 | 4.5 | Adamsville | Pennsylvania |
| June 9, 1975 | 4.2 | Altona | New York |
| May 29, 1983 | 4.2 | Peru | Maine |
| April 23, 1984 | 4.2 | Conestoga | Pennsylvania |
| January 16, 1994 | 4.2 | Sinking Spring | Pennsylvania |
| November 3, 1975 | 4 | Long Lake | New York |
| June 17, 1991 | 4 | Worcester | New York |
The largest earthquake in U.S. history, however, was the 1964 Good Friday quake in Alaska, measuring 9.2 magnitude and killing 131 people.

-

 Misc1 week ago
How Hard Is It to Get Into an Ivy League School?
-

 Technology2 weeks ago
Ranked: Semiconductor Companies by Industry Revenue Share
-

 Markets2 weeks ago
Ranked: The World’s Top Flight Routes, by Revenue
-

 Countries2 weeks ago
Population Projections: The World’s 6 Largest Countries in 2075
-

 Markets2 weeks ago
The Top 10 States by Real GDP Growth in 2023
-

 Demographics2 weeks ago
The Smallest Gender Wage Gaps in OECD Countries
-

 United States2 weeks ago
Where U.S. Inflation Hit the Hardest in March 2024
-

 Environment2 weeks ago
Top Countries By Forest Growth Since 2001