Energy
Animation: U.S. Electric Vehicle Sales (2010-19)
It’s challenging to get ahead, but it’s even harder to stay ahead.
For companies looking to create a sustainable competitive advantage in a fast-moving, capital intensive, and nascent sector like manufacturing electric vehicles, this is a simple reality that must be accounted for.
Every milestone achieved is met with the onset of new and more sophisticated competitors – and as the industry grows, the stakes grow higher and the market gets further de-risked. Then, the real 800-lb gorillas start to climb their way in, making competition even more fierce.
Visualizing U.S. EV Sales
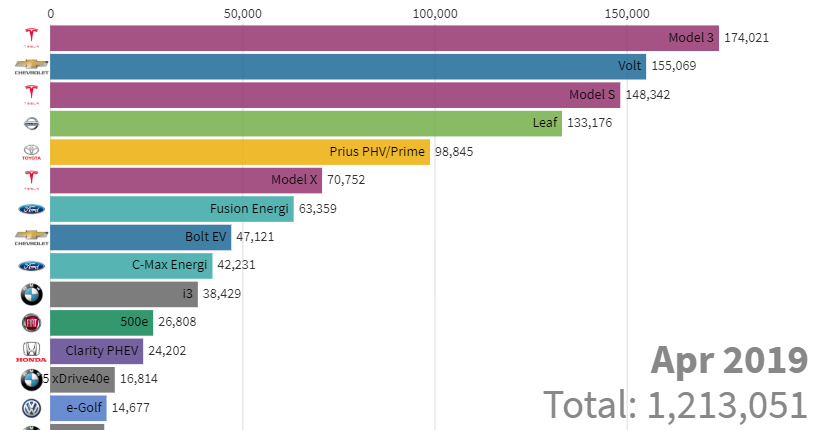
Today’s animation uses data from InsideEVs to show almost nine years of U.S. sales in the electric vehicle market, sorted by model of car.
It paints a picture of a rapidly evolving market with many new competitors sweeping in to try and claim a stake. You can see the leads of early successes eroded away, the increasing value of scale, and consumer preferences, all rolled into one nifty animation.
Animation currently unavailable
The Tesla Roadster starts with a very early lead, but is soon replaced by the Nissan Leaf and Chevrolet Volt, which are the most sold models in the U.S. from 2011-2016.
Closer to the end, the Tesla Model S rises fast to eventually surpass the Leaf by the end of 2017. Finally, the scale of the rollout of the Tesla Model 3 is put into real perspective, as it quickly jumps past all other models in the span of roughly one year.
The Gorilla Search
While Tesla’s rise has been well-documented, it’s also unclear how long the company can maintain an EV leadership position in the North American market.
As carmakers double-down on EVs as their future foundations, many well-capitalized competitors are entering the fray with serious and ambitious plans to make a dent in the market.
In the previous animation, you can already see there are multiple models from BMW, Volkswagen, Honda, Fiat, Ford, Toyota, Nissan, and Chevrolet that have accumulated over 10,000 sales – and as these manufacturers continue to pour capital in the sector, they are likely posturing to try and find how to create the next mass market EV.
Of these, Volkswagen seems to be the most bullish on a global transition to EVs, and the company is expecting to have 50 fully electric models by 2025 while investing $40 billion into new EV technologies (such as batteries) along the way.
The Chinese Bigfoot?
However, the 800-lb gorilla could come from the other side of the Pacific as well.
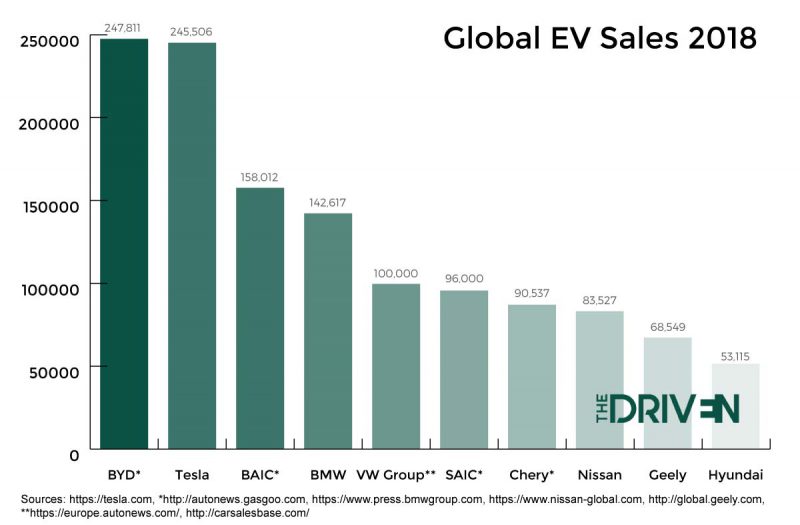
Source: The Driven
Chinese company BYD – which is backed by Warren Buffett – is currently the largest EV manufacturer in the world, selling 250,000 EVs in 2018.
The Chinese carmaker quietly manufacturers buses in the U.S. already, and it has also announced future plans to sell its cars in the U.S. as well.
How will such an animation of cumulative U.S. EV sales look in the future? In such a rapidly evolving space, it seems it could go any which way.


Energy
Charted: 4 Reasons Why Lithium Could Be the Next Gold Rush
Visual Capitalist has partnered with EnergyX to show why drops in prices and growing demand may make now the right time to invest in lithium.


4 Reasons Why You Should Invest in Lithium
Lithium’s importance in powering EVs makes it a linchpin of the clean energy transition and one of the world’s most precious minerals.
In this graphic, Visual Capitalist partnered with EnergyX to explore why now may be the time to invest in lithium.
1. Lithium Prices Have Dropped
One of the most critical aspects of evaluating an investment is ensuring that the asset’s value is higher than its price would indicate. Lithium is integral to powering EVs, and, prices have fallen fast over the last year:
| Date | LiOH·H₂O* | Li₂CO₃** |
|---|---|---|
| Feb 2023 | $76 | $71 |
| March 2023 | $71 | $61 |
| Apr 2023 | $43 | $33 |
| May 2023 | $43 | $33 |
| June 2023 | $47 | $45 |
| July 2023 | $44 | $40 |
| Aug 2023 | $35 | $35 |
| Sept 2023 | $28 | $27 |
| Oct 2023 | $24 | $23 |
| Nov 2023 | $21 | $21 |
| Dec 2023 | $17 | $16 |
| Jan 2024 | $14 | $15 |
| Feb 2024 | $13 | $14 |
Note: Monthly spot prices were taken as close to the 14th of each month as possible.
*Lithium hydroxide monohydrate MB-LI-0033
**Lithium carbonate MB-LI-0029
2. Lithium-Ion Battery Prices Are Also Falling
The drop in lithium prices is just one reason to invest in the metal. Increasing economies of scale, coupled with low commodity prices, have caused the cost of lithium-ion batteries to drop significantly as well.
In fact, BNEF reports that between 2013 and 2023, the price of a Li-ion battery dropped by 82%.
| Year | Price per KWh |
|---|---|
| 2023 | $139 |
| 2022 | $161 |
| 2021 | $150 |
| 2020 | $160 |
| 2019 | $183 |
| 2018 | $211 |
| 2017 | $258 |
| 2016 | $345 |
| 2015 | $448 |
| 2014 | $692 |
| 2013 | $780 |

3. EV Adoption is Sustainable
One of the best reasons to invest in lithium is that EVs, one of the main drivers behind the demand for lithium, have reached a price point similar to that of traditional vehicle.
According to the Kelly Blue Book, Tesla’s average transaction price dropped by 25% between 2022 and 2023, bringing it in line with many other major manufacturers and showing that EVs are a realistic transport option from a consumer price perspective.
| Manufacturer | September 2022 | September 2023 |
|---|---|---|
| BMW | $69,000 | $72,000 |
| Ford | $54,000 | $56,000 |
| Volkswagon | $54,000 | $56,000 |
| General Motors | $52,000 | $53,000 |
| Tesla | $68,000 | $51,000 |
4. Electricity Demand in Transport is Growing
As EVs become an accessible transport option, there’s an investment opportunity in lithium. But possibly the best reason to invest in lithium is that the IEA reports global demand for the electricity in transport could grow dramatically by 2030:
| Transport Type | 2022 | 2025 | 2030 |
|---|---|---|---|
| Buses 🚌 | 23,000 GWh | 50,000 GWh | 130,000 GWh |
| Cars 🚙 | 65,000 GWh | 200,000 GWh | 570,000 GWh |
| Trucks 🛻 | 4,000 GWh | 15,000 GWh | 94,000 GWh |
| Vans 🚐 | 6,000 GWh | 16,000 GWh | 72,000 GWh |
The Lithium Investment Opportunity
Lithium presents a potentially classic investment opportunity. Lithium and battery prices have dropped significantly, and recently, EVs have reached a price point similar to other vehicles. By 2030, the demand for clean energy, especially in transport, will grow dramatically.
With prices dropping and demand skyrocketing, now is the time to invest in lithium.
EnergyX is poised to exploit lithium demand with cutting-edge lithium extraction technology capable of extracting 300% more lithium than current processes.

-

 Lithium6 days ago
Ranked: The Top 10 EV Battery Manufacturers in 2023
Asia dominates this ranking of the world’s largest EV battery manufacturers in 2023.
-

 Energy2 weeks ago
The World’s Biggest Nuclear Energy Producers
China has grown its nuclear capacity over the last decade, now ranking second on the list of top nuclear energy producers.
-

 Energy1 month ago
The World’s Biggest Oil Producers in 2023
Just three countries accounted for 40% of global oil production last year.
-

 Energy1 month ago
How Much Does the U.S. Depend on Russian Uranium?
Currently, Russia is the largest foreign supplier of nuclear power fuel to the U.S.
-

 Uranium2 months ago
Charted: Global Uranium Reserves, by Country
We visualize the distribution of the world’s uranium reserves by country, with 3 countries accounting for more than half of total reserves.
-

 Energy3 months ago
Visualizing the Rise of the U.S. as Top Crude Oil Producer
Over the last decade, the United States has established itself as the world’s top producer of crude oil, surpassing Saudi Arabia and Russia.


-

 Brands6 days ago
How Tech Logos Have Evolved Over Time
-

 Economy2 weeks ago
Where U.S. Inflation Hit the Hardest in March 2024
-

 Green2 weeks ago
Top Countries By Forest Growth Since 2001
-

 United States2 weeks ago
Ranked: The Largest U.S. Corporations by Number of Employees
-

 Maps2 weeks ago
The Largest Earthquakes in the New York Area (1970-2024)
-

 Green2 weeks ago
Ranked: The Countries With the Most Air Pollution in 2023
-

 Green2 weeks ago
Ranking the Top 15 Countries by Carbon Tax Revenue
-

 Markets2 weeks ago
U.S. Debt Interest Payments Reach $1 Trillion