Markets
7 Facts That Will Free You From the Fear of Stock Market Crashes
.container {
max-width: 1070px;
}
.button {
display: inline-block;
height: 45px;
color: #ffffff;
text-align: center;
font-family: helvetica;
letter-spacing: .01rem;
text-decoration: none;
white-space: nowrap;
border-radius: 0px;
line-height: 45px;
border: 1px;
font-size: em(13);
cursor: pointer;
box-sizing: border-box;
background: #22255A;
transition-duration: 0.4s;
margin-bottom: 1px;
width: 16.6666%;
}
.button-group {
position: left;
width: 100%;
display: inline-block;
list-style: none;
padding: 0;
margin: 0;
/* IE hacks */
zoom: 1;
*display: inline;
}
.button-group li {
float: left;
padding: 0;
margin: 0;
}
.button-group .button {
display: inline-block;
box-sizing: border-box;
color: white;
}
.button-group > .button:not(:first-child):not(:last-child), .button-group li:not(:first-child):not(:last-child) .button {
border-radius: 0;
}
.button-group > .button:first-child, .button-group li:first-child .button {
margin-left: 0;
border-top-right-radius: 0;
border-bottom-right-radius: 0;
}
.button-group > .button:last-child, .button-group li:last-child > .button {
border-top-left-radius: 0;
border-bottom-left-radius: 0;
border-bottom-right-radius: 0;
}
.button:hover {
background-color: #8E8059;
}
.button.active {
background-color: #8E8059;
}
.button-group :not(:last-child) {
border-right: 1px solid white;
padding-right: 2px;
}
.button-group {
border-right: none;
margin-right: none;
}
@media (max-width: 600px) {
.button {
font-size: 13px;}
}

7 Facts That Will Free You From a Fear of Stock Market Crashes
The current bull market in stocks is closing in on an astounding 10 years in length, making it the longest bull market run in all of modern history.
Largest Bull Markets
| Rank | Bull Market | Length |
|---|---|---|
| #1 | 09’-18’ (Current) | 115 months* |
| #2 | ’90-‘00 | 114 months |
| #3 | ’49-‘56 | 86 months |
| #4 | ’74-‘80 | 74 months |
| #5 | ’82-‘87 | 60 months |
*As of September 2018
Understandably, this makes many people very nervous.
Everyone remembers the mayhem of 2008 – and with stock prices at all-time highs, the fear of a market meltdown is a valid concern for many investors.
How to Become Unshakeable
Today’s infographic is from Tony Robbins, leveraging data and talking points from his #1 Best Selling book Unshakeable: Your Financial Freedom Playbook, which is now available on paperback.
It leans on insights from the world’s top investors – like Ray Dalio and John Bogle – to present seven indisputable facts about market crashes, using clear patterns established over decades of data.
By understanding these seven facts, you’ll be able to prepare for the recurring seasons of the financial market, including winter, and it will help give you an enormous edge over even many sophisticated and experienced investors.
Seven Indisputable Facts
Here are the seven facts that will free you from a fear of stock market crashes:
Fact #1: On average, corrections happen once per year
For more than a century, the market has seen close to one correction (a decline of 10% or more) per year. In other words, corrections are a regular part of financial seasons – and you can expect to see as many corrections as birthdays throughout your life.
The average correction looks something like this:
- 54 days long
- 13.5% market decline
- Occurs once per year
The uncertainty of a correction can prompt people to make big mistakes – but in reality, most corrections are over before you know it. If you hold on tight, it’s likely the storm will pass.
Fact #2: Fewer than 20% of all corrections turn into a bear market
When the stock market starts tumbling, it can be tempting to abandon ship by selling assets and moving into cash. However, doing so could be a big mistake.
You would likely be selling all of your assets at a low, right before the market rebounds!
Why? Fewer than 20% of corrections turn into bear markets. Put another way, 80% of corrections are just short breaks in otherwise intact bull markets – meaning that selling early would make you miss the rest of the upward trend.
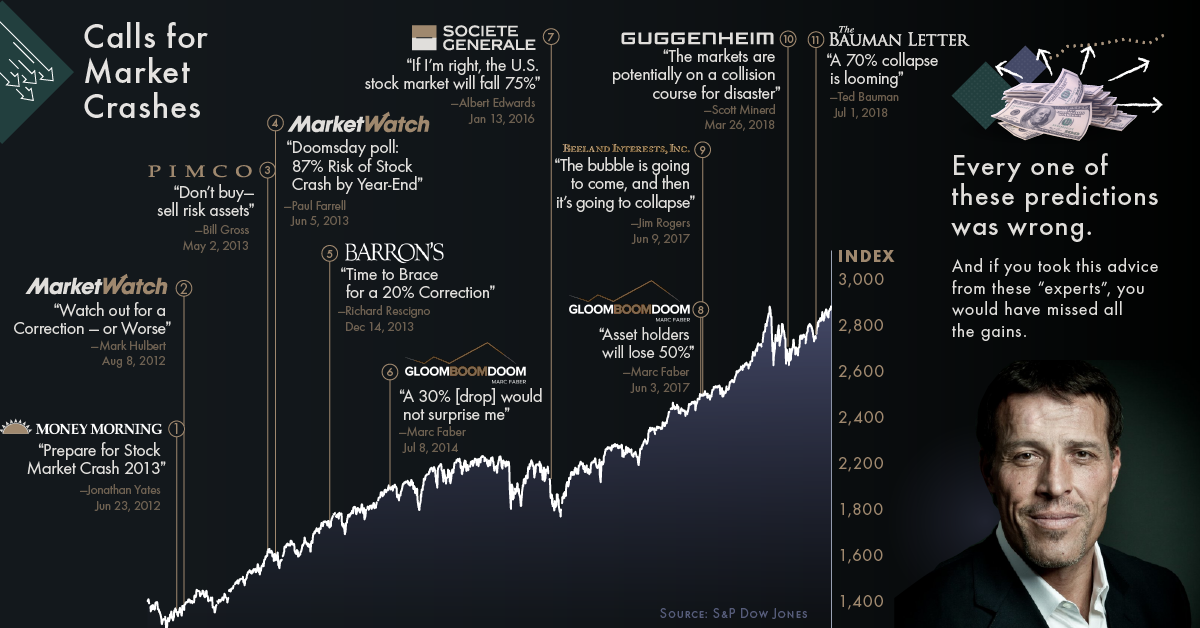
Fact #3: Nobody can predict consistently whether the market will rise or fall
The media perpetuates a myth that, if you’re smart enough, you can predict the market’s moves and avoid its downdrafts.
But the reality is: no one can time the market.
During the current nine year bull market, there have been dozens of calls for stock market crashes from even very seasoned investors. None of these calls have come true, and if you’d have listened to these experts, you would have missed the upside.
The only value of stock forecasters is to make fortune-tellers look good.
– Warren Buffett
Fact #4: The market has always risen, despite short-term setbacks
Market drops are a very regular occurrence. For example, the S&P 500 – the main index that tracks the U.S. stock market – has fallen on average 14.2% at least one point each year between 1980-2015.
Like winter, these drops are a part of the market’s seasons. Over this same period of time, despite these temporary drops, the market ended up achieving a positive return 27 of 36 years. That’s 75% of the time!
Fact #5: Historically, bear markets have happened every three to five years
In the 115 year span between 1900-2015, there have been 34 bear markets.
But bear markets don’t last. Over that timeframe, they’ve varied in length from 45 days to 694 days, but on average they lasted about a year.
Fact #6: Bear markets become bull markets
Do you remember how fragile the world seemed in 2008 when banks were collapsing and the stock market was in free fall?
When you pictured the future, did it seem dark and dangerous? Or did it seem like the good times were just around the corner and the party was about to begin?
The fact is, once a bear market ends, the following 12 months can see crucial market gains.
The best opportunities come in times of maximum pessimism.
– John Templeton
Fact #7: The greatest danger is being out of the market
From 1996 through 2015, the S&P 500 returned an average of 8.2% a year.
But if you missed out on the top 10 trading days during that period, your returns dwindled to just 4.5% a year.
It gets worse! If you missed out on the top 20 trading days, your returns were just 2.1%.
And if you missed out on the top 30 trading days? Your returns vanished into thin air, falling all the way to zero!
You can’t win by sitting on the bench. You have to be in the game. To put it another way, fear isn’t rewarded. Courage is.
– Tony Robbins


Markets
The European Stock Market: Attractive Valuations Offer Opportunities
On average, the European stock market has valuations that are nearly 50% lower than U.S. valuations. But how can you access the market?


European Stock Market: Attractive Valuations Offer Opportunities
Europe is known for some established brands, from L’Oréal to Louis Vuitton. However, the European stock market offers additional opportunities that may be lesser known.
The above infographic, sponsored by STOXX, outlines why investors may want to consider European stocks.
Attractive Valuations
Compared to most North American and Asian markets, European stocks offer lower or comparable valuations.
| Index | Price-to-Earnings Ratio | Price-to-Book Ratio |
|---|---|---|
| EURO STOXX 50 | 14.9 | 2.2 |
| STOXX Europe 600 | 14.4 | 2 |
| U.S. | 25.9 | 4.7 |
| Canada | 16.1 | 1.8 |
| Japan | 15.4 | 1.6 |
| Asia Pacific ex. China | 17.1 | 1.8 |
Data as of February 29, 2024. See graphic for full index names. Ratios based on trailing 12 month financials. The price to earnings ratio excludes companies with negative earnings.
On average, European valuations are nearly 50% lower than U.S. valuations, potentially offering an affordable entry point for investors.
Research also shows that lower price ratios have historically led to higher long-term returns.
Market Movements Not Closely Connected
Over the last decade, the European stock market had low-to-moderate correlation with North American and Asian equities.
The below chart shows correlations from February 2014 to February 2024. A value closer to zero indicates low correlation, while a value of one would indicate that two regions are moving in perfect unison.
| EURO STOXX 50 | STOXX EUROPE 600 | U.S. | Canada | Japan | Asia Pacific ex. China |
|
|---|---|---|---|---|---|---|
| EURO STOXX 50 | 1.00 | 0.97 | 0.55 | 0.67 | 0.24 | 0.43 |
| STOXX EUROPE 600 | 1.00 | 0.56 | 0.71 | 0.28 | 0.48 | |
| U.S. | 1.00 | 0.73 | 0.12 | 0.25 | ||
| Canada | 1.00 | 0.22 | 0.40 | |||
| Japan | 1.00 | 0.88 | ||||
| Asia Pacific ex. China | 1.00 |
Data is based on daily USD returns.
European equities had relatively independent market movements from North American and Asian markets. One contributing factor could be the differing sector weights in each market. For instance, technology makes up a quarter of the U.S. market, but health care and industrials dominate the broader European market.
Ultimately, European equities can enhance portfolio diversification and have the potential to mitigate risk for investors.
Tracking the Market
For investors interested in European equities, STOXX offers a variety of flagship indices:
| Index | Description | Market Cap |
|---|---|---|
| STOXX Europe 600 | Pan-regional, broad market | €10.5T |
| STOXX Developed Europe | Pan-regional, broad-market | €9.9T |
| STOXX Europe 600 ESG-X | Pan-regional, broad market, sustainability focus | €9.7T |
| STOXX Europe 50 | Pan-regional, blue-chip | €5.1T |
| EURO STOXX 50 | Eurozone, blue-chip | €3.5T |
Data is as of February 29, 2024. Market cap is free float, which represents the shares that are readily available for public trading on stock exchanges.
The EURO STOXX 50 tracks the Eurozone’s biggest and most traded companies. It also underlies one of the world’s largest ranges of ETFs and mutual funds. As of November 2023, there were €27.3 billion in ETFs and €23.5B in mutual fund assets under management tracking the index.
“For the past 25 years, the EURO STOXX 50 has served as an accurate, reliable and tradable representation of the Eurozone equity market.”
— Axel Lomholt, General Manager at STOXX
Partnering with STOXX to Track the European Stock Market
Are you interested in European equities? STOXX can be a valuable partner:
- Comprehensive, liquid and investable ecosystem
- European heritage, global reach
- Highly sophisticated customization capabilities
- Open architecture approach to using data
- Close partnerships with clients
- Part of ISS STOXX and Deutsche Börse Group
With a full suite of indices, STOXX can help you benchmark against the European stock market.
Learn how STOXX’s European indices offer liquid and effective market access.

-

 Economy2 days ago
Economic Growth Forecasts for G7 and BRICS Countries in 2024
The IMF has released its economic growth forecasts for 2024. How do the G7 and BRICS countries compare?
-

 Markets1 week ago
U.S. Debt Interest Payments Reach $1 Trillion
U.S. debt interest payments have surged past the $1 trillion dollar mark, amid high interest rates and an ever-expanding debt burden.
-

 United States2 weeks ago
Ranked: The Largest U.S. Corporations by Number of Employees
We visualized the top U.S. companies by employees, revealing the massive scale of retailers like Walmart, Target, and Home Depot.
-

 Markets2 weeks ago
The Top 10 States by Real GDP Growth in 2023
This graphic shows the states with the highest real GDP growth rate in 2023, largely propelled by the oil and gas boom.
-

 Markets2 weeks ago
Ranked: The World’s Top Flight Routes, by Revenue
In this graphic, we show the highest earning flight routes globally as air travel continued to rebound in 2023.
-

 Markets3 weeks ago
Ranked: The Most Valuable Housing Markets in America
The U.S. residential real estate market is worth a staggering $47.5 trillion. Here are the most valuable housing markets in the country.


-

 Debt1 week ago
How Debt-to-GDP Ratios Have Changed Since 2000
-
Markets2 weeks ago
Ranked: The World’s Top Flight Routes, by Revenue
-

 Countries2 weeks ago
Population Projections: The World’s 6 Largest Countries in 2075
-
Markets2 weeks ago
The Top 10 States by Real GDP Growth in 2023
-

 Demographics2 weeks ago
The Smallest Gender Wage Gaps in OECD Countries
-

 United States2 weeks ago
Where U.S. Inflation Hit the Hardest in March 2024
-

 Green2 weeks ago
Top Countries By Forest Growth Since 2001
-
United States2 weeks ago
Ranked: The Largest U.S. Corporations by Number of Employees