Technology
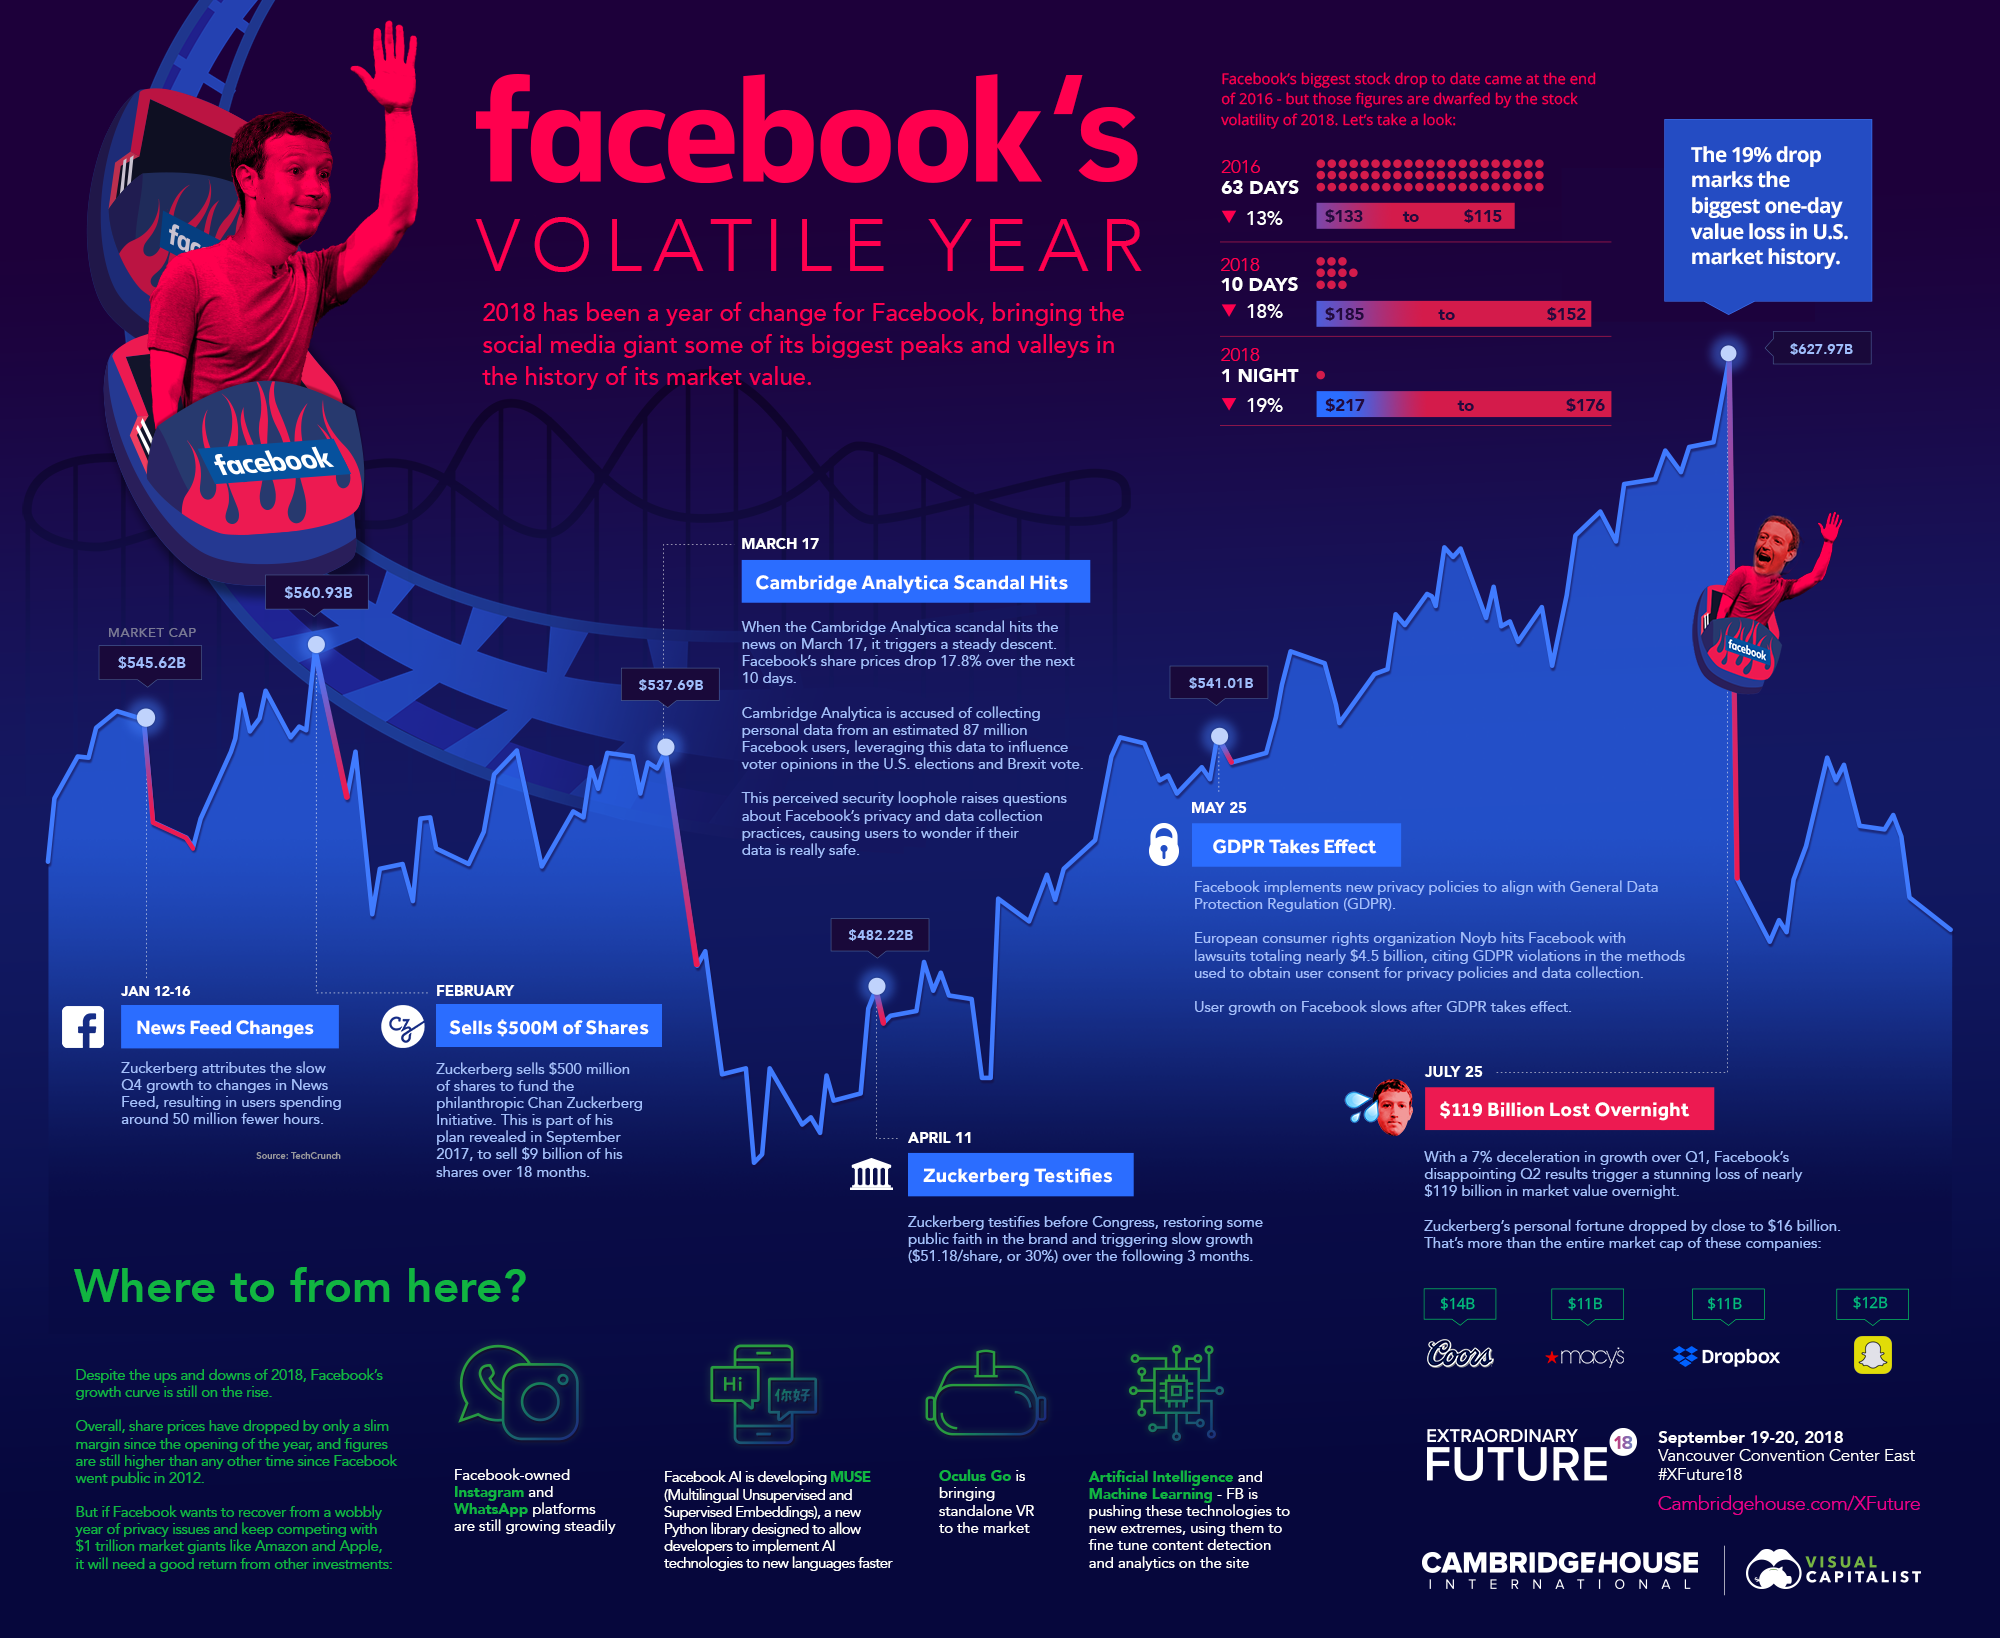
Facebook’s Volatile Year in One Giant Chart
View a high resolution version of this graphic.
Facebook’s Volatile Year in One Giant Chart
View the high resolution version of today’s graphic by clicking here.
Facebook has found itself in the headlines a lot in 2018, but not for reasons investors are likely to be excited about.
The tech giant battled privacy scandals, policy changes, and dwindling user engagement throughout the year, and in July the company made history with an overnight drop of $119 billion in market capitalization – the single largest drop in U.S. history.
We did today’s chart in conjunction with Extraordinary Future 2018, a tech conference featuring Cambridge Analytica whistleblower Christopher Wylie as a speaker on Sep 19-20 in Vancouver, BC, to show Facebook’s volatile year in perspective.
Here is a recap of some of the more major events that prompted volatility so far in 2018:
Zuckerberg Sells Shares
Facebook CEO Mark Zuckerberg drew attention in September 2017 when he announced plans to systematically sell off up to $12 billion in stock – nearly 50% of his personal stake.
It’s all part of a plan to transfer the bulk of his stake to the Chan-Zuckerberg Initiative. Zuckerberg and his wife Priscilla Chan founded the philanthropic company at the end of 2015 with the stated focus of “personalized learning, curing disease, connecting people and building strong communities.”
Zuckerberg started unloading stock with an initial sale of 1.14 million shares in February 2018 – the biggest insider sale of shares of any public company in the preceding three months. While analysts didn’t see any red flags for the sale at the time, the volume came when the share price needed all the stability it could get.
Facebook’s Privacy Scandal
On March 16, The Guardian and The New York Times published joint exposés reporting that 50 million Facebook user profiles were harvested by Cambridge Analytica without user knowledge. Later estimates pegged that number at closer to 87 million profiles.
Facebook soon found itself the focus of an investigation from the Federal Trade Commission, and published full-page ads in British and American newspapers to apologize for a “breach of trust”. As Facebook scrambled to regain user trust, share values dropped by 17.8% over the 10 days after the scandal broke.
In April, Zuckerberg appeared before Senate to answer tough questions about Facebook’s privacy policies. The CEO’s testimony restored some faith in the stock, and it gained some traction over the next three months, but the damage was already done.
Facebook’s History-Making Stock Drop
Facebook posted disappointing Q2 results on July 24, attributing their sluggish quarter to dropping user numbers and continued privacy challenges driven by General Data Protection Regulation (GDPR) deadlines.
The report triggered an overnight stock drop of 19% – the single biggest one-day value loss ($119 billion) in U.S. stock market history.
As a result of the rout, Zuckerberg’s personal fortune dropped by nearly $16 billion, an amount that exceeds the total market cap of companies like Dropbox or Snapchat.
Where to from here?
Is this the end for Facebook? The halo may have slipped from the social media golden child, but the company may not be in danger quite yet.
The company’s namesake social network is not the only sandbox it plays in, and the company’s diversity is just the thing that might keep Facebook afloat amidst changing social media sentiment.
Facebook’s purchases of Instagram and WhatsApp are paying off, as those platforms continue to grow steadily. Meanwhile, the investment in Oculus Go could be a game-changer for VR, bringing standalone virtual reality systems to the home market. Finally, Facebook is leveraging its main social network as a place to fine tune algorithms and pave the way for new developments in artificial intelligence and machine learning.
Despite Facebook’s challenges in the realm of social media this year, its expansion into other emerging technologies might help the company secure its future.


Technology
Visualizing AI Patents by Country
See which countries have been granted the most AI patents each year, from 2012 to 2022.


Visualizing AI Patents by Country
This was originally posted on our Voronoi app. Download the app for free on iOS or Android and discover incredible data-driven charts from a variety of trusted sources.
This infographic shows the number of AI-related patents granted each year from 2010 to 2022 (latest data available). These figures come from the Center for Security and Emerging Technology (CSET), accessed via Stanford University’s 2024 AI Index Report.
From this data, we can see that China first overtook the U.S. in 2013. Since then, the country has seen enormous growth in the number of AI patents granted each year.
| Year | China | EU and UK | U.S. | RoW | Global Total |
|---|---|---|---|---|---|
| 2010 | 307 | 137 | 984 | 571 | 1,999 |
| 2011 | 516 | 129 | 980 | 581 | 2,206 |
| 2012 | 926 | 112 | 950 | 660 | 2,648 |
| 2013 | 1,035 | 91 | 970 | 627 | 2,723 |
| 2014 | 1,278 | 97 | 1,078 | 667 | 3,120 |
| 2015 | 1,721 | 110 | 1,135 | 539 | 3,505 |
| 2016 | 1,621 | 128 | 1,298 | 714 | 3,761 |
| 2017 | 2,428 | 144 | 1,489 | 1,075 | 5,136 |
| 2018 | 4,741 | 155 | 1,674 | 1,574 | 8,144 |
| 2019 | 9,530 | 322 | 3,211 | 2,720 | 15,783 |
| 2020 | 13,071 | 406 | 5,441 | 4,455 | 23,373 |
| 2021 | 21,907 | 623 | 8,219 | 7,519 | 38,268 |
| 2022 | 35,315 | 1,173 | 12,077 | 13,699 | 62,264 |
In 2022, China was granted more patents than every other country combined.
While this suggests that the country is very active in researching the field of artificial intelligence, it doesn’t necessarily mean that China is the farthest in terms of capability.
Key Facts About AI Patents
According to CSET, AI patents relate to mathematical relationships and algorithms, which are considered abstract ideas under patent law. They can also have different meaning, depending on where they are filed.
In the U.S., AI patenting is concentrated amongst large companies including IBM, Microsoft, and Google. On the other hand, AI patenting in China is more distributed across government organizations, universities, and tech firms (e.g. Tencent).
In terms of focus area, China’s patents are typically related to computer vision, a field of AI that enables computers and systems to interpret visual data and inputs. Meanwhile America’s efforts are more evenly distributed across research fields.
Learn More About AI From Visual Capitalist
If you want to see more data visualizations on artificial intelligence, check out this graphic that shows which job departments will be impacted by AI the most.

-

 Markets1 week ago
U.S. Debt Interest Payments Reach $1 Trillion
-

 Business2 weeks ago
Charted: Big Four Market Share by S&P 500 Audits
-

 Real Estate2 weeks ago
Ranked: The Most Valuable Housing Markets in America
-

 Money2 weeks ago
Which States Have the Highest Minimum Wage in America?
-

 AI2 weeks ago
Ranked: Semiconductor Companies by Industry Revenue Share
-

 Markets2 weeks ago
Ranked: The World’s Top Flight Routes, by Revenue
-

 Demographics2 weeks ago
Population Projections: The World’s 6 Largest Countries in 2075
-

 Markets2 weeks ago
The Top 10 States by Real GDP Growth in 2023