Misc
Visualizing the World’s 100 Biggest Islands
View the full-size version of the infographic.
Visualizing 100 of the World’s Biggest Islands
View the full-size version of the infographic by clicking here.
When you think of an island, the first thing that might come to mind is a small, sunny beach surrounded by warm waters. But did you know that 11% of the world’s population actually calls islands their home?
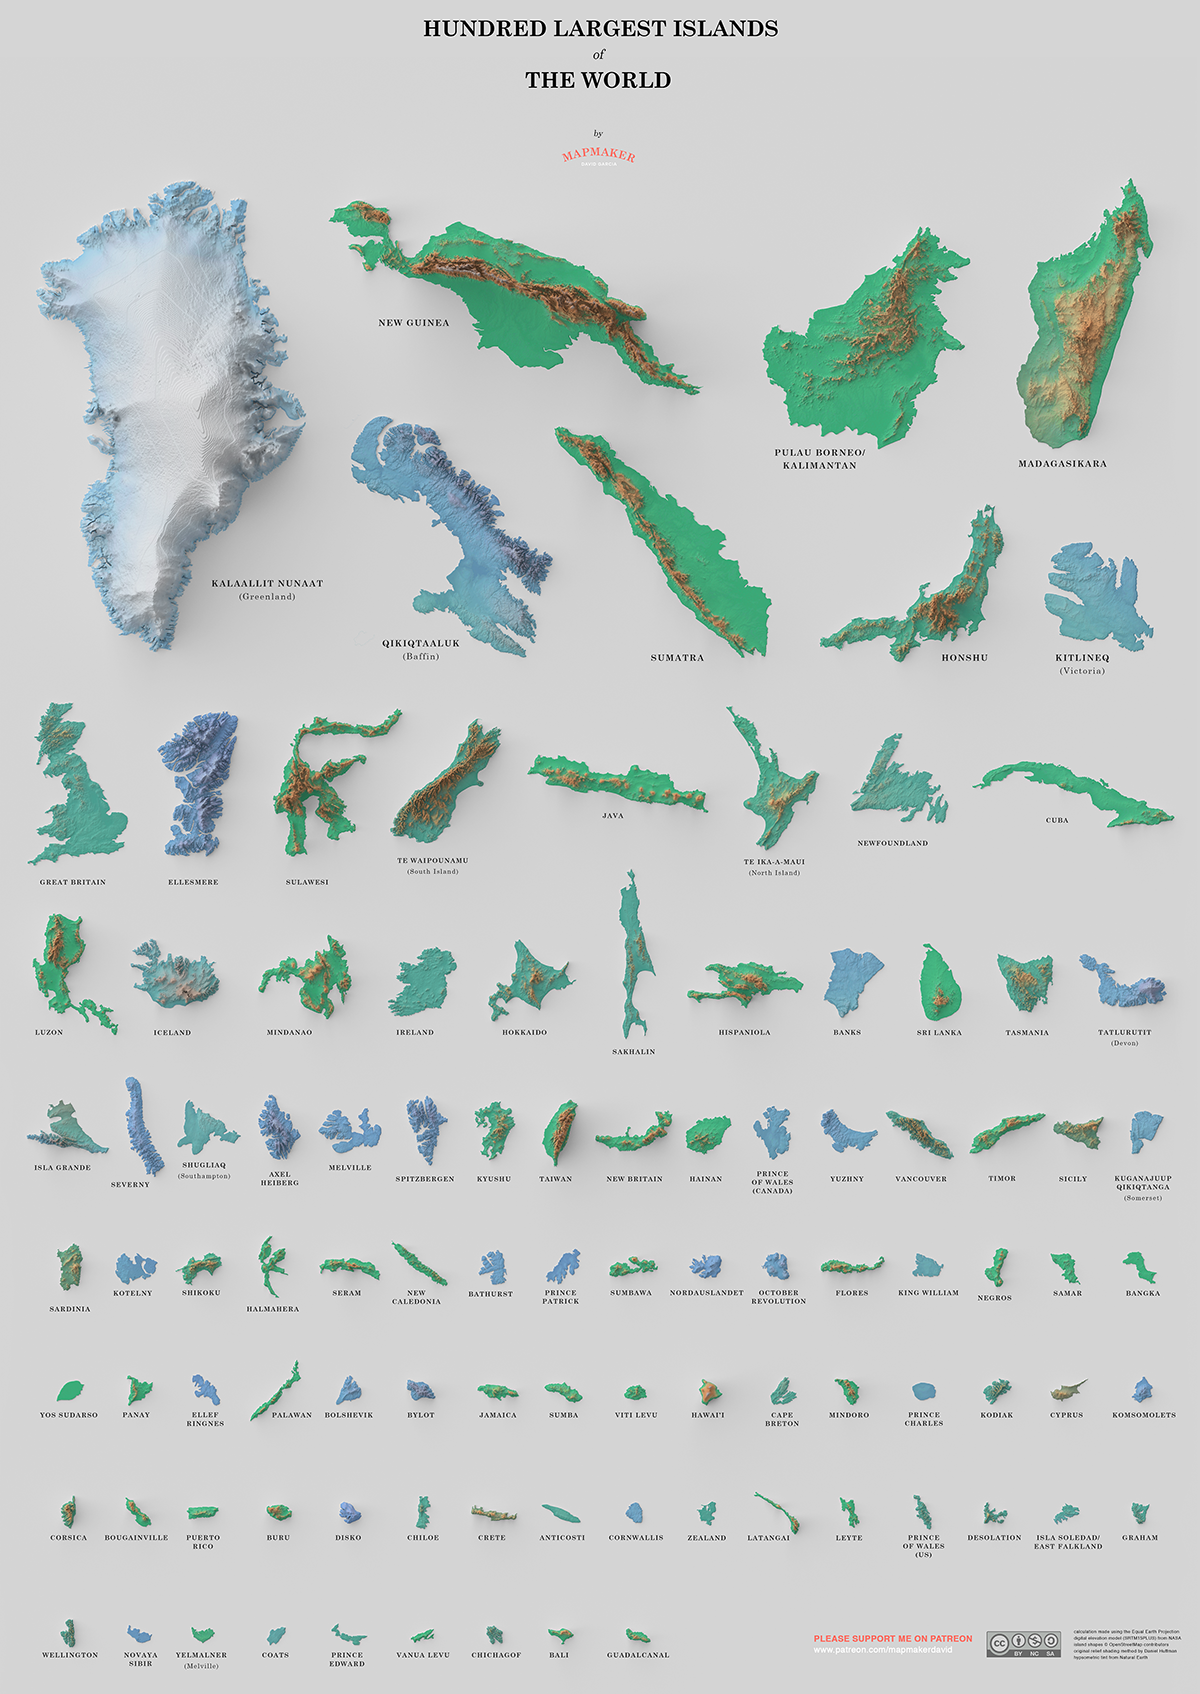
Today’s data visualization is designed by mapmaker David Garcia, and it ranks the 100 largest islands found around the world by size.
Islands in the Stream
The 100 biggest islands range from the likes of expansive Greenland to independent Guadalcanal, the largest of the Solomon Islands. But look a little closer, and you’ll see just how much the top contender outshines the rest. Greenland is almost three times the size of the second-biggest island of New Guinea, and you could fit over 408 Guadalcanal islands within it.
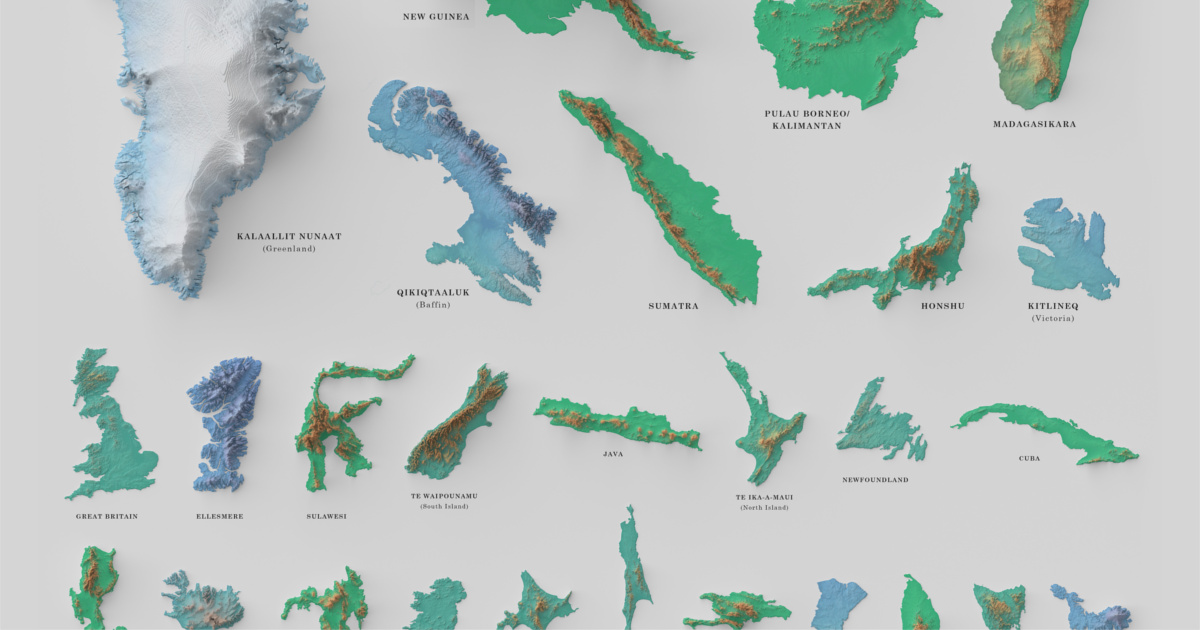
In the visualization, the islands are also tinted, depending on the climate they come from. Blue islands are from the polar regions, turquoise islands lie in the temperate zones, and green islands represent the lush tropics. Which of these regions hosts the most islands?
| Island | Countries | Region |
|---|---|---|
| Kalaallit Nunaat (Greenland) | Denmark | Europe |
| New Guinea | Papua New Guinea, Indonesia | Oceania |
| Pulau Borneo (Kalimantan) | Indonesia, Malaysia, Brunei | Asia |
| Madagasikara | Madagascar | Africa |
| Qikiqtaaluk (Baffin Island, Nunavut) | Canada | North America |
| Sumatra | Indonesia | Asia |
| Honshu | Japan | Asia |
| Kitlineq (Victoria Island) | Canada | North America |
| Great Britain | United Kingdom | Europe |
| Ellesmere (Nunavut) | Canada | North America |
| Sulawesi | Indonesia | Asia |
| Te Waipounamu (South Island) | New Zealand | Oceania |
| Java | Indonesia | Asia |
| Te Ika-a-maui (North Island) | New Zealand | Oceania |
| Newfoundland | Canada | North America |
| Cuba | Cuba | North America |
| Luzon | Philippines | Asia |
| Iceland | Iceland | Europe |
| Mindanao | Philippines | Asia |
| Ireland | Ireland, United Kingdom | Europe |
| Hokkaido | Japan | Asia |
| Sakhalin | Russia | Eurasia |
| Hispaniola | Dominican Republic, Haiti | North America |
| Banks Island | Canada | North America |
| Sri Lanka | Sri Lanka | Asia |
| Tasmania | Australia | Oceania |
| Tatlurutit (Devon Island, Nunavut) | Canada | North America |
| Isla Grande de Tierra del Fuego | Panama | South America |
| Severny | Russia | Eurasia |
| Shugliaq (Southampton) | Canada | North America |
| Axel Heiberg (Nunavut) | Canada | North America |
| Melville | Canada | North America |
| Spitsbergen (Svalbard) | Norway | Europe |
| Kyushu | Japan | Asia |
| Taiwan | Taiwan | Asia |
| New Britain | Papua New Guinea | Oceania |
| Hainan | China | Asia |
| Prince of Wales (Nunavut) | Canada | North America |
| Yuzhny | Russia | Eurasia |
| Vancouver | Canada | North America |
| Timor | Timor Leste | Asia |
| Sicily | Italy | Europe |
| Kuganajuup Qikiqtanga (Somerset, Nunavut) | Canada | North America |
| Sardinia | Italy | Europe |
| Kotelny | Russia | Eurasia |
| Shikoku | Japan | Asia |
| Halmahera | Indonesia | Asia |
| Seram | Indonesia | Asia |
| New Caledonia | France | Europe |
| Bathurst (Nunavut) | Canada | North America |
| Prince Patrick | Canada | North America |
| Sumbawa | Indonesia | Asia |
| Nordaustlandet | Norway | Europe |
| October Revolution | Russia | Eurasia |
| Flores | Indonesia | Asia |
| King William (Nunavut) | Canada | North America |
| Negros | Philippines | Asia |
| Samar | Philippines | Asia |
| Bangka | Indonesia | Asia |
| Yos Sudarso | Papua New Guinea | Oceania |
| Panay | Philippines | Asia |
| Ellef Ringnes (Nunavut) | Canada | North America |
| Palawan | Philippines | Asia |
| Bolshevik | Russia | Eurasia |
| Bylot (Nunavut) | Canada | North America |
| Jamaica | Caribbean | North America |
| Sumba | Indonesia | Asia |
| Viti Levu | Fiji | Oceania |
| Hawai'I (Big Island) | United States | North America |
| Cape Breton | Canada | North America |
| Mindoro | Philippines | Asia |
| Prince Charles | Canada | North America |
| Kodiak (Alaska) | United States | North America |
| Cyprus | Cyprus, United Kingdom | Europe |
| Komsomolets | Russia | Eurasia |
| Corsica | France | Europe |
| Bougainville | Papua New Guinea | Oceania |
| Puerto Rico | United States | North America |
| Buru | Indonesia | Asia |
| Disko | Greenland | Europe |
| Chiloé | Chile | South America |
| Crete | Greece | Europe |
| Anticosti | Canada | North America |
| Cornwallis (Nunavut) | Canada | North America |
| Zealand | Denmark | Europe |
| Latangai (New Ireland) | Papua New Guinea | Oceania |
| Leyte | Philippines | Asia |
| Prince of Wales (Alaska) | United States | North America |
| Desolation (Kerguelen) | Antarctic Lands, France | Antarctic |
| Isla Soledad/ East Falkland | Argentina | South America |
| Graham | Canada | North America |
| Wellington | Chile | South America |
| Novaya Sibir (New Siberian) | Russia | Eurasia |
| Yelmalner/ Melville | Australia | Oceania |
| Coats (Nunavut) | Canada | North America |
| Prince Edward | Canada | North America |
| Vanua Levu | Fiji | Oceania |
| Chichagof (Alaska) | United States | North America |
| Bali | Indonesia | Asia |
| Guadalcanal | Solomon Islands | Oceania |
It’s the Island Life for Many
North America dominates with 32 islands out of the top 100, but there’s a catch — twelve of them are uninhabitable, thanks to the frigid Arctic temperatures.
Throw the number of people into the mix and the regional overview gets even more interesting. Compared to the rest of the world, Asian islands are teeming with life.
- 28 Asian islands
Total population: 510.4 million - 14 European islands
Total population: 83.8 million - 32 North American islands
Total population: 40.7 million - 12 Oceania islands
Total population: 18.3 million
Taking things a step further, we’ve remixed the visualization based on population density.
Click below to view the full-size version.
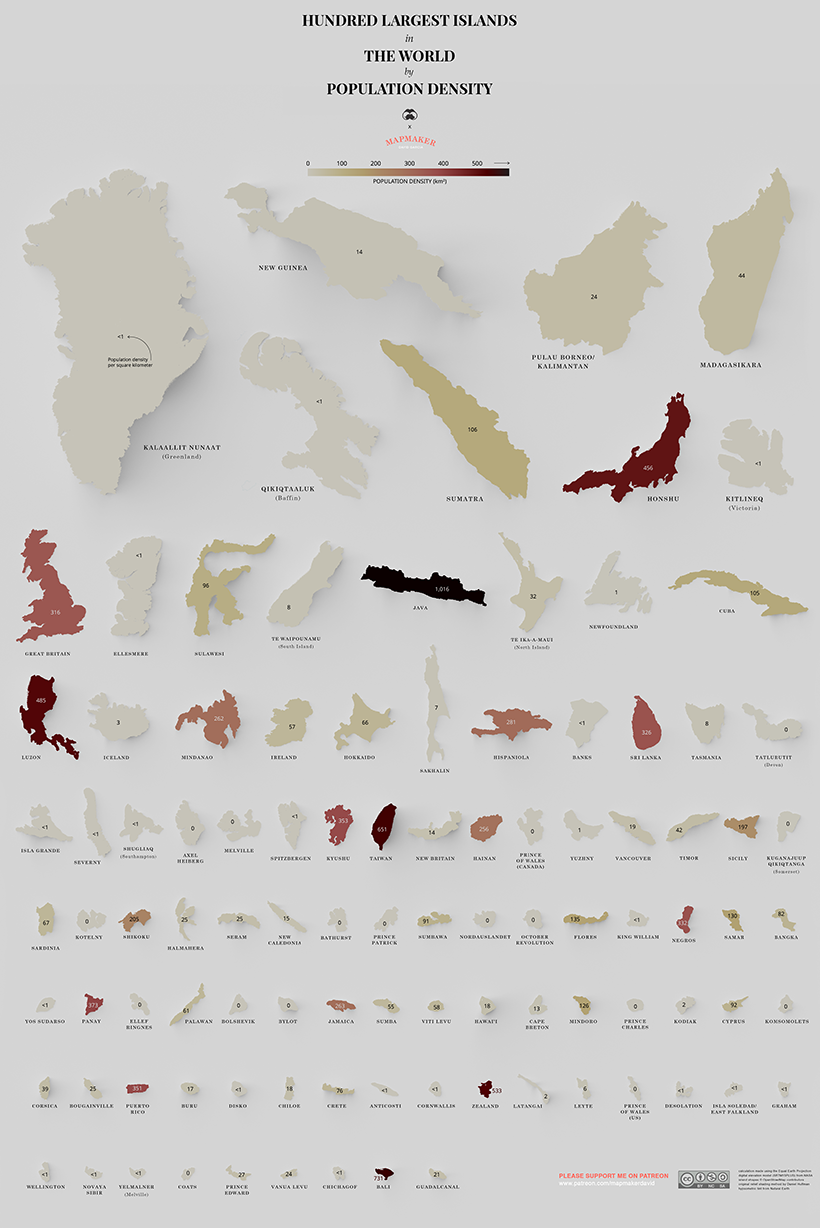
The most populated island in the world, Java is filled to the brim with 141 million people — that’s over a thousand people per square kilometer. This is in part thanks to the capital city Jakarta being located on the island, but experts warn those days may be short-lived. By 2050, scientific models predict that 95% of the city may be underwater, and that Indonesia must scramble to find a new capital.
To finish, here is the 20 most dense islands on the list, in terms of population density.
| Rank by Density | Island | Countries | Population | Area (km²) | People per km² |
|---|---|---|---|---|---|
| #1 | Java | Indonesia | 141,000,000 | 138,793 | 1,015.9 |
| #2 | Bali | Indonesia | 4,225,000 | 5,780 | 731.0 |
| #3 | Taiwan | Taiwan | 23,571,000 | 36,193 | 651.3 |
| #4 | Zealand | Denmark | 3,749,200 | 7,031 | 533.2 |
| #5 | Luzon | Philippines | 53,336,134 | 109,965 | 485.0 |
| #6 | Honshu | Japan | 104,000,000 | 227,960 | 456.2 |
| #7 | Panay | Philippines | 4,477,247 | 12,011 | 372.8 |
| #8 | Kyushu | Japan | 12,970,479 | 36,753 | 352.9 |
| #9 | Puerto Rico | United States | 3,195,000 | 9,104 | 350.9 |
| #10 | Negros | Philippines | 4,414,131 | 13,310 | 331.6 |
| #11 | Sri Lanka | Sri Lanka | 21,440,000 | 65,610 | 326.8 |
| #12 | Great Britain | United Kingdom | 66,040,000 | 209,331 | 315.5 |
| #13 | Hispaniola | Dominican Republic, Haiti | 21,396,000 | 76,192 | 280.8 |
| #14 | Jamaica | Caribbean | 2,890,000 | 10,992 | 262.9 |
| #15 | Mindanao | Philippines | 25,537,691 | 97,530 | 261.8 |
| #16 | Hainan | China | 8,670,000 | 33,920 | 255.6 |
| #17 | Shikoku | Japan | 3,845,534 | 18800 | 204.5 |
| #18 | Sicily | Italy | 5,057,000 | 25,711 | 196.7 |
| #19 | Flores | Indonesia | 1,831,000 | 13,540 | 135.2 |
| #20 | Samar | Philippines | 1,751,267 | 13,429 | 130.4 |
The Australia-Island Debate
Upon first publishing this over two years ago, the most common feedback we heard came from our friends Down Under.
In school, many Australians learned that their beloved country was an “island continent”, and naturally felt it should be included on the list of the world’s 100 biggest islands.
As with anything, there are different schools of thought on this. Upon digging deeper, we believed that Encyclopedia Britannica had a explanatory take on the issue:
“Most geographers consider islands and continents to be separate things. An island is a mass of land that is both ‘entirely surrounded by water’ and also ‘smaller than a continent.’ By that definition, Australia can’t be an island because it’s already a continent.”
–Encyclopedia Britannica
There are, of course, opposing arguments that could be had—but at least this gives some perspective on why Australia was likely excluded from this particular list.
This post was first published in 2019. We have since updated it, adding in new content for 2021.


Politics
Charted: Trust in Government Institutions by G7 Countries
How much do you trust the government and its various institutions? We look at data for G7 countries for the time period of 2006-2023.


Trust in Government Institutions by G7 Countries
This was originally posted on our Voronoi app. Download the app for free on iOS or Android and discover incredible data-driven charts from a variety of trusted sources.
How much do you trust the government, and its various institutions?
It’s likely that your level of confidence probably depends on a wide range of factors, such as perceived competency, historical context, economic performance, accountability, social cohesion, and transparency.
And for these same reasons, trust levels in government institutions also change all the time, even in the world’s most developed countries: the G7.
Confidence in Government by G7 Countries (2006-2023)
This chart looks at the changes in trust in government institutions between the years 2006 and 2023, based on data from a multi-country Gallup poll.
Specifically, this dataset aggregates confidence in multiple national institutions, including the military, the judicial system, the national government, and the integrity of the electoral system.
| Country | Confidence (2006) | Confidence (2023) | Change (p.p.) |
|---|---|---|---|
| Canada | 57% | 64% | +7 |
| Britain | 63% | 63% | +0 |
| Germany | 55% | 61% | +6 |
| France | 54% | 60% | +6 |
| Japan | 48% | 59% | +11 |
| Italy | 41% | 54% | +13 |
| United States | 63% | 50% | -13 |
What’s interesting here is that in the G7, a group of the world’s most developed economies, there is only one country bucking the general trend: the United States.
Across most G7 countries, confidence in institutions has either improved or stayed the same between 2006 and 2023. The largest percentage point (p.p.) increases occur in Italy and Japan, which saw +13 p.p. and +11 p.p. increases in trust over the time period.
In the U.S., however, confidence in government institutions has fallen by 13 p.p. over the years. What happened?
Key Figures on U.S. Trust in Institutions
In 2006, the U.S. was tied with the UK as having the highest confidence in government institutions, at 63%.
But here’s where the scores stand in 2023, across various institutions:
| 🇺🇸 Institutions | Confidence (2023) |
|---|---|
| Military | 81% |
| Judiciary | 42% |
| National Government | 30% |
| Elections | 44% |
| Overall | 49% |
Based on this data, it’s clear that the U.S. lags behind in three key indicators: confidence in the national government, confidence in the justice system, and confidence in fair elections. It ranked in last place for each indicator in the G7.
One other data point that stands out: despite leading the world in military spending, the U.S. is only the third most confident in its military in the G7. It lags behind France (86%) and the United Kingdom (83%).

-

 Wealth6 days ago
Charted: Which City Has the Most Billionaires in 2024?
-

 Mining2 weeks ago
Gold vs. S&P 500: Which Has Grown More Over Five Years?
-

 Uranium2 weeks ago
The World’s Biggest Nuclear Energy Producers
-

 Education2 weeks ago
How Hard Is It to Get Into an Ivy League School?
-

 Debt2 weeks ago
How Debt-to-GDP Ratios Have Changed Since 2000
-

 Sports2 weeks ago
The Highest Earning Athletes in Seven Professional Sports
-

 Science2 weeks ago
Visualizing the Average Lifespans of Mammals
-

 Brands1 week ago
How Tech Logos Have Evolved Over Time