Politics
Timeline: Cannabis Legislation in the U.S.
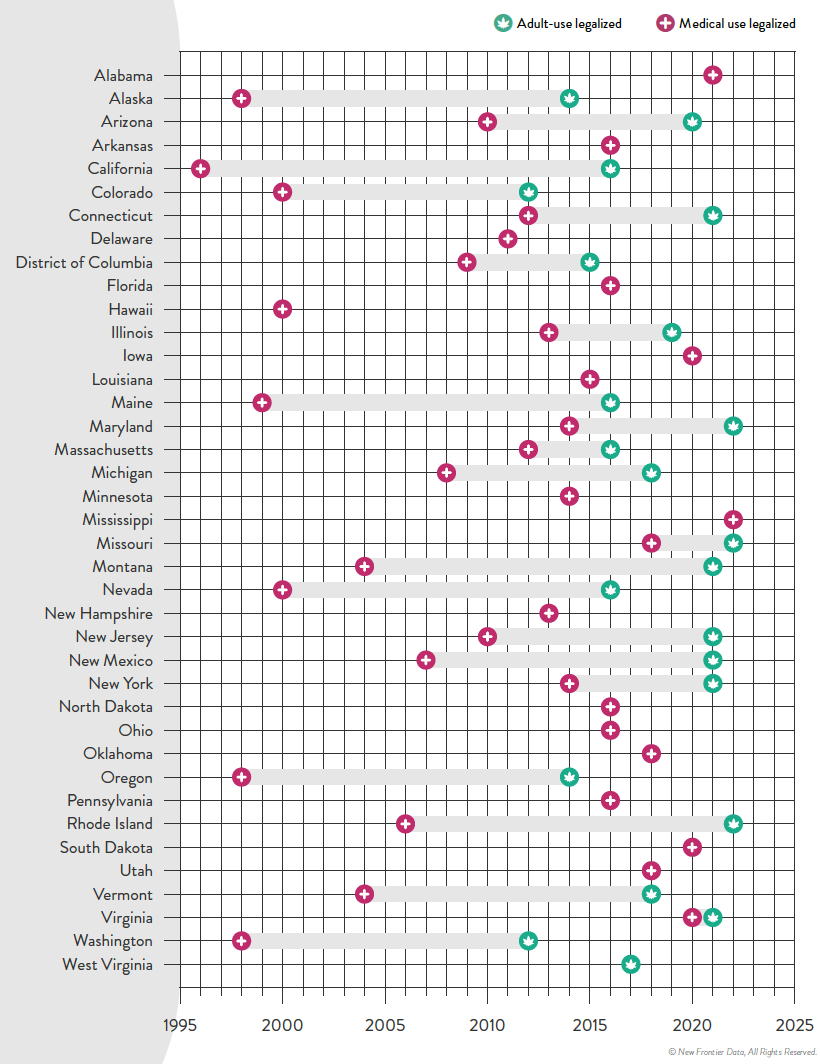
Timeline: Cannabis Legislation in the U.S.
At the federal level, cannabis is still considered an illegal substance. That said, individual states do have the right to determine their own laws around cannabis sales and usage.
This visual from New Frontier Data looks at the status of cannabis in every state and the timeline of when medical and/or recreational use became legal.
Cannabis Through the Years
In the U.S., the oldest legalese concerning cannabis dates back to the 1600s—the colony of Virginia required every farm to grow and produce hemp. Since then, cannabis use was fairly wide open until the 1930s when the Marihuana Tax Act was enforced, prohibiting marijuana federally but still technically allowing medical use.
Jumping ahead, the Controlled Substances Act was passed in 1970, classifying cannabis as Schedule I drug—the same category as heroin. This prohibited any use of the substance.
However, the 1970s also saw a counter movement, wherein many states made the move towards decriminalization. Decriminalization means that although possessing cannabis remained illegal, a person would not be subject to jail time or prosecution for possessing certain amounts.
By the 1990s, some of the first states passed laws to allow the medical usage of cannabis, and by 2012 two states in the U.S.—Washington and Colorado—legalized the recreational use of cannabis.
Cannabis Legislation Today and Beyond
The MORE Act (the Marijuana Opportunity Reinvestment and Expungement Act) was passed in the House early 2022, and if made law, it would decriminalize marijuana federally.
“This bill decriminalizes marijuana. Specifically, it removes marijuana from the list of scheduled substances under the Controlled Substances Act and eliminates criminal penalties for an individual who manufactures, distributes, or possesses marijuana.”– U.S. Congress
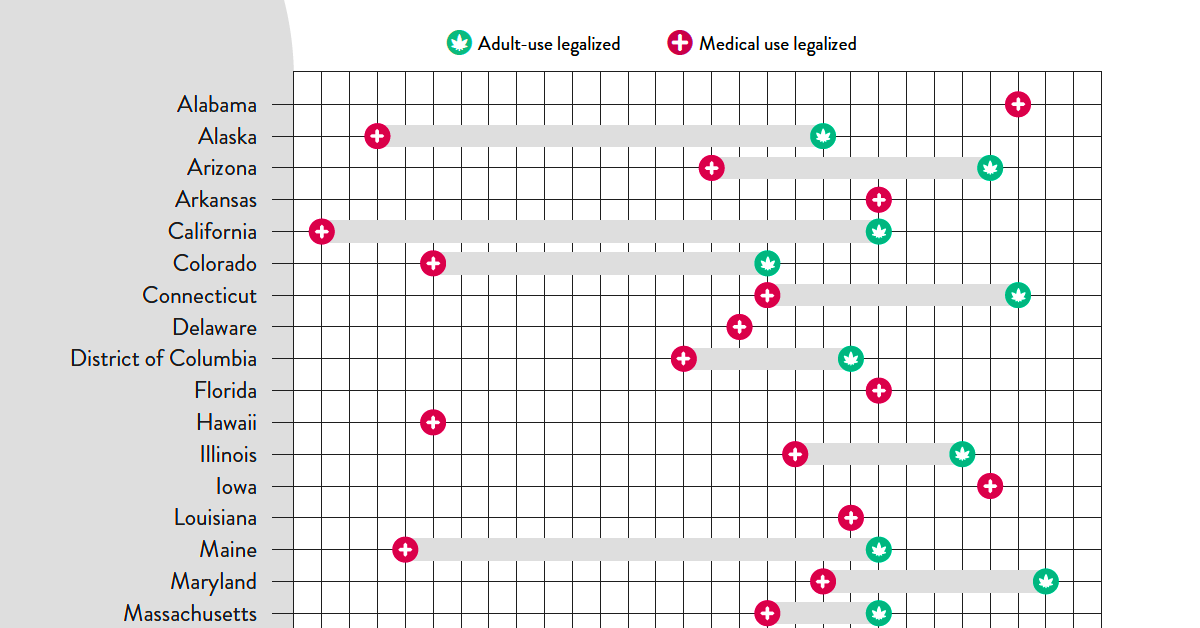
Cannabis still remains illegal at the federal level, but at the state levels, cannabis is now fully legal (both for medicinal and recreational purposes) in a total of 22 states.
Over 246 million Americans have legal access to some form of marijuana products with high THC levels. Looking to the future, many new cannabis markets are expected to open up in the next few years:
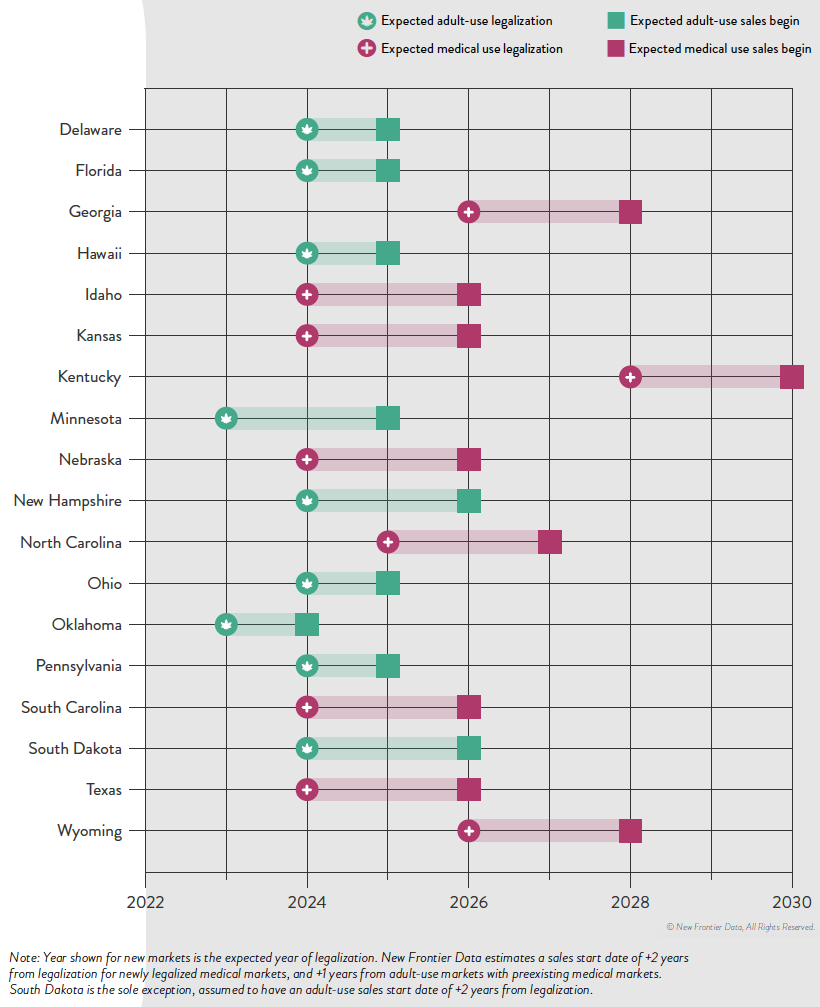
The earliest states expected to open up next for recreational cannabis sales are Minnesota and Oklahoma. There is always a lag between legalization and actual sales, wherein local regulatory bodies and governments set standards. States like Kentucky, on the other hand, aren’t likely to even legalize medicinal cannabis until 2028.
It’s estimated that by 2030, there will be 69 million cannabis consumers in the country, up 33% from 2022.
Overall, the U.S. cannabis market is likely an important one to watch as legal sales hit $30 billion in 2022. By the end of the decade, that number is expected to be anywhere from $58 billion to as much as $72 billion.
Economy
The Bloc Effect: International Trade with Geopolitical Allies on the Rise
Rising geopolitical tensions are shaping the future of international trade, but what is the effect on trading among G7 and BRICS countries?


The Bloc Effect: International Trade with Allies on the Rise
International trade has become increasingly fragmented over the last five years as countries have shifted to trading more with their geopolitical allies.
This graphic from The Hinrich Foundation, the first in a three-part series covering the future of trade, provides visual context to the growing divide in trade in G7 and pre-expansion BRICS countries, which are used as proxies for geopolitical blocs.
Trade Shifts in G7 and BRICS Countries
This analysis uses IMF data to examine differences in shares of exports within and between trading blocs from 2018 to 2023. For example, we looked at the percentage of China’s exports with other BRICS members as well as with G7 members to see how these proportions shifted in percentage points (pp) over time.
Countries traded nearly $270 billion more with allies in 2023 compared to 2018. This shift came at the expense of trade with rival blocs, which saw a decline of $314 billion.
Country Change in Exports Within Bloc (pp) Change in Exports With Other Bloc (pp)
🇮🇳 India 0.0 3.9
🇷🇺 Russia 0.7 -3.8
🇮🇹 Italy 0.8 -0.7
🇨🇦 Canada 0.9 -0.7
🇫🇷 France 1.0 -1.1
🇪🇺 EU 1.1 -1.5
🇩🇪 Germany 1.4 -2.1
🇿🇦 South Africa 1.5 1.5
🇺🇸 U.S. 1.6 -0.4
🇯🇵 Japan 2.0 -1.7
🇨🇳 China 2.1 -5.2
🇧🇷 Brazil 3.7 -3.3
🇬🇧 UK 10.2 0.5
All shifts reported are in percentage points. For example, the EU saw its share of exports to G7 countries rise from 74.3% in 2018 to 75.4% in 2023, which equates to a 1.1 percentage point increase.
The UK saw the largest uptick in trading with other countries within the G7 (+10.2 percentage points), namely the EU, as the post-Brexit trade slump to the region recovered.
Meanwhile, the U.S.-China trade dispute caused China’s share of exports to the G7 to fall by 5.2 percentage points from 2018 to 2023, the largest decline in our sample set. In fact, partly as a result of the conflict, the U.S. has by far the highest number of harmful tariffs in place.
The Russia-Ukraine War and ensuing sanctions by the West contributed to Russia’s share of exports to the G7 falling by 3.8 percentage points over the same timeframe.
India, South Africa, and the UK bucked the trend and continued to witness advances in exports with the opposing bloc.
Average Trade Shifts of G7 and BRICS Blocs
Though results varied significantly on a country-by-country basis, the broader trend towards favoring geopolitical allies in international trade is clear.
Bloc Change in Exports Within Bloc (pp) Change in Exports With Other Bloc (pp)
Average 2.1 -1.1
BRICS 1.6 -1.4
G7 incl. EU 2.4 -1.0
Overall, BRICS countries saw a larger shift away from exports with the other bloc, while for G7 countries the shift within their own bloc was more pronounced. This implies that though BRICS countries are trading less with the G7, they are relying more on trade partners outside their bloc to make up for the lost G7 share.
A Global Shift in International Trade and Geopolitical Proximity
The movement towards strengthening trade relations based on geopolitical proximity is a global trend.
The United Nations categorizes countries along a scale of geopolitical proximity based on UN voting records.
According to the organization’s analysis, international trade between geopolitically close countries rose from the first quarter of 2022 (when Russia first invaded Ukraine) to the third quarter of 2023 by over 6%. Conversely, trade with geopolitically distant countries declined.
The second piece in this series will explore China’s gradual move away from using the U.S. dollar in trade settlements.
Visit the Hinrich Foundation to learn more about the future of geopolitical trade

-

 Misc26 mins ago
Visualizing the Most Common Pets in the U.S.
Lions, tigers, and bears, oh my!—these animals do not feature on this list of popular American household pets.
-

 Economy3 days ago
Economic Growth Forecasts for G7 and BRICS Countries in 2024
The IMF has released its economic growth forecasts for 2024. How do the G7 and BRICS countries compare?
-

 United States2 weeks ago
Ranked: The Largest U.S. Corporations by Number of Employees
We visualized the top U.S. companies by employees, revealing the massive scale of retailers like Walmart, Target, and Home Depot.
-

 Economy2 weeks ago
Where U.S. Inflation Hit the Hardest in March 2024
We visualized product categories that saw the highest % increase in price due to U.S. inflation as of March 2024.
-

 Economy1 month ago
G20 Inflation Rates: Feb 2024 vs COVID Peak
We visualize inflation rates across G20 countries as of Feb 2024, in the context of their COVID-19 pandemic peak.
-

 Economy1 month ago
Mapped: Unemployment Claims by State
This visual heatmap of unemployment claims by state highlights New York, California, and Alaska leading the country by a wide margin.

-

 Culture1 week ago
The Highest Earning Athletes in Seven Professional Sports
-

 Countries2 weeks ago
Population Projections: The World’s 6 Largest Countries in 2075
-

 Markets2 weeks ago
The Top 10 States by Real GDP Growth in 2023
-

 Demographics2 weeks ago
The Smallest Gender Wage Gaps in OECD Countries
-
Economy2 weeks ago
Where U.S. Inflation Hit the Hardest in March 2024
-

 Green2 weeks ago
Top Countries By Forest Growth Since 2001
-
United States2 weeks ago
Ranked: The Largest U.S. Corporations by Number of Employees
-

 Maps2 weeks ago
The Largest Earthquakes in the New York Area (1970-2024)