Green
The Top Global Risks in 2019
The Chart of the Week is a weekly Visual Capitalist feature on Fridays.
The suits are pressed and the jets are gassed up, as global political and business leaders prepare to converge in Davos for the World Economic Forum.
To prep the wide variety of world leaders attending the summit, the organization has just published its most recent edition of the Global Risks Report. The highly anticipated annual presentation puts the world’s most pressing issues into focus, giving a sense of what is top-of-mind for global decision-makers.
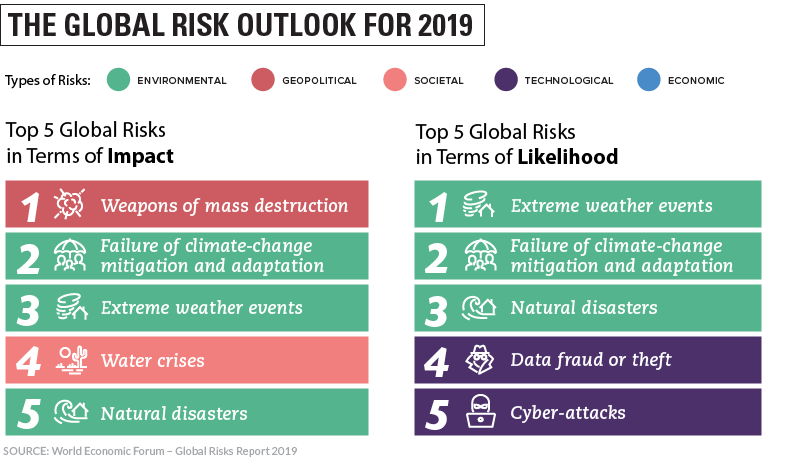
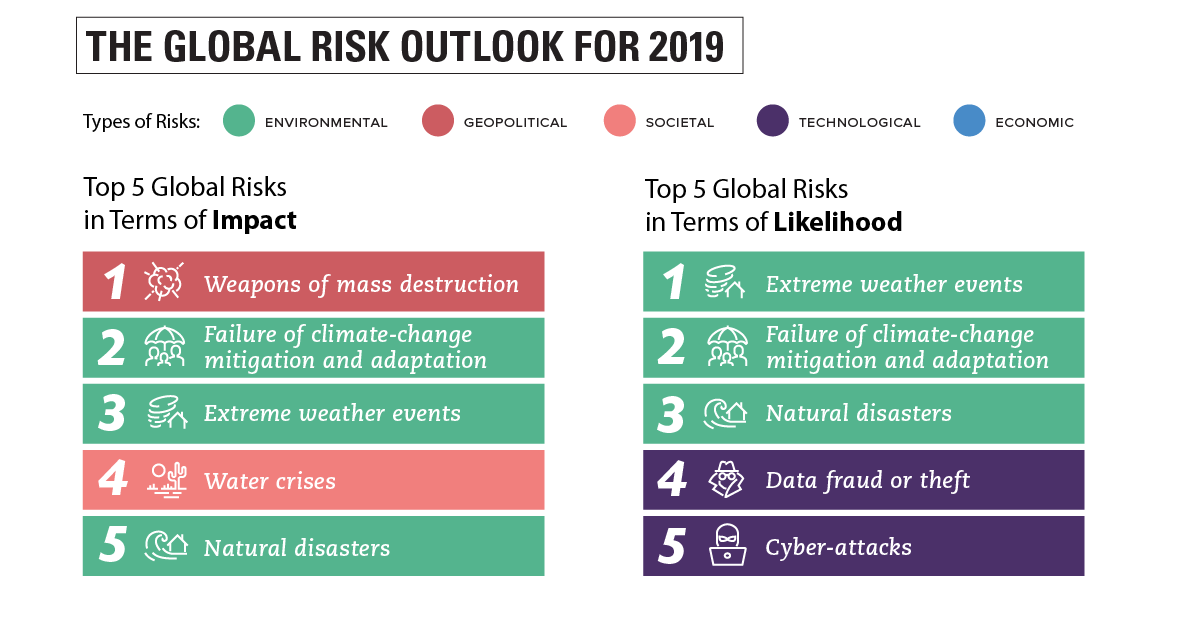
Below are the top five risks highlighted in this year’s report.
The World’s Evolving Risk Landscape
The report looks at two specific ways of evaluating global risks:
- The likelihood of an event occurring
- The impact or severity of an event, should it occur
And over recent years, it’s clear that the composition of these top threats has evolved.
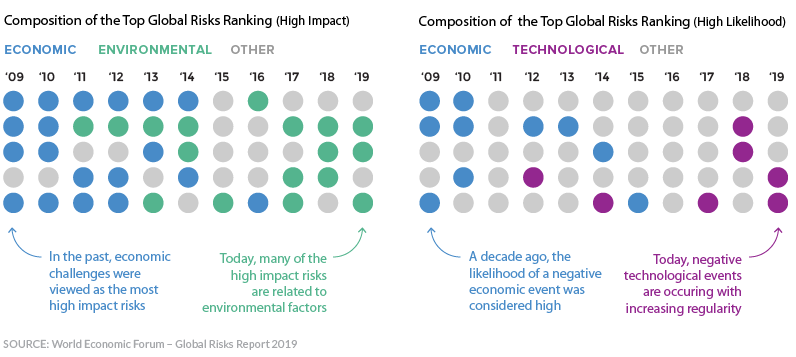
In 2009, the world was still reeling from the global financial crisis, so economic concerns were naturally at the forefront of discussions.
Today, the most likely scenarios to play out in the near future involve extreme weather events and natural disasters. Also trending upward are cyber-security threats and concerns over the security of personal data.
Risk Perception
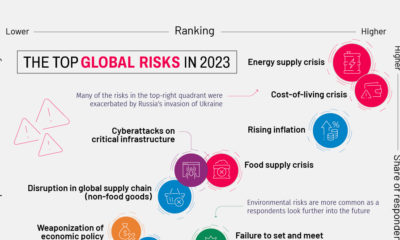
Each year, the Global Risks Perception Survey looks at which risks are viewed by global decision-makers as increasing in the coming year.
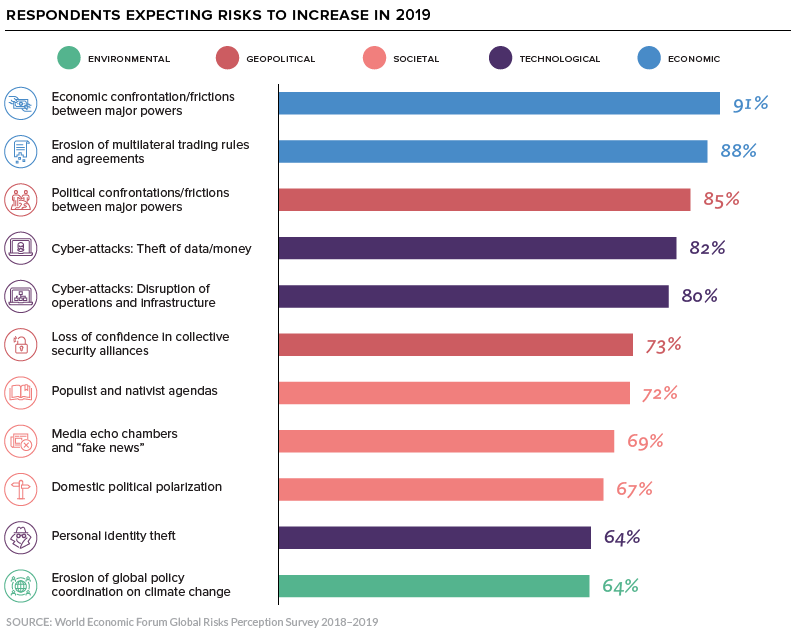
Some clear themes emerge from the responses:
A Breakdown in Geopolitical Cooperation
From trade wars to the dissolution of weapons treaties, cooperation between countries is on the decline. Leaders are concerned that this divergent geopolitical climate may continue to inhibit collective progress on important global challenges.
Technological Instabilities
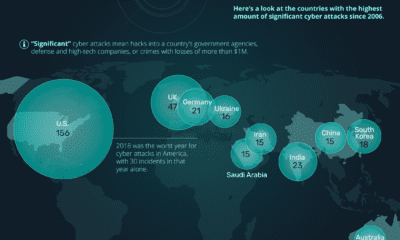
As the influence of technology creeps into more aspects of everyday life, cyber-attacks and lax cybersecurity protocols are becoming more of a concern. In one dramatic example information theft, multiple breaches of India’s government ID database reportedly left the information of over 1 billion registered citizens exposed. Technology is influencing society in other ways too, such as the pervasive issue of “fake news”.
Polarization of Government and Society
One of the major themes of this year’s forum will be addressing increasing polarization in many countries.
Where opposing political groups previously expressed frustration with each other, they now express fear and anger.
– Global Risks Report 2019
Gauging the National Sentiment
The report also looks at questions related to human happiness too.
One might ask, “Is the world becoming a better or worse place?” That, of course, is a complicated question, and one that is influenced by geography and socioeconomic standing.
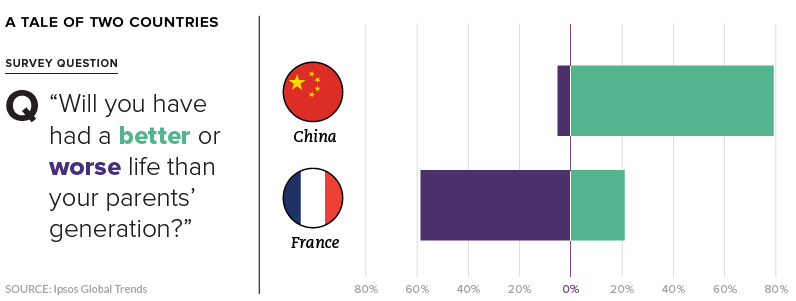
Survey data also shows that when people are asked to compare their lives to their parents’ generation, the answers vary greatly from country to country.
The prevailing opinion in China is that things are improving, whereas nearly 60% of French respondents had a pessimistic view of the realities facing their generation. While France has a uniquely gloomy outlook on the future, this uncertainty is reflected in the opinion of citizens in many other developed democracies as well.
In Davos, global leaders will be pondering a similar question: How do we move towards a brighter future for the next generation when the collective will for tackling global problems appears to be weakening?


Green
The Carbon Footprint of Major Travel Methods
Going on a cruise ship and flying domestically are the most carbon-intensive travel methods.


The Carbon Footprint of Major Travel Methods
This was originally posted on our Voronoi app. Download the app for free on iOS or Android and discover incredible data-driven charts from a variety of trusted sources.
Did you know that transport accounts for nearly one-quarter of global energy-related carbon dioxide (CO₂) emissions?
This graphic illustrates the carbon footprints of major travel methods measured in grams of carbon dioxide equivalent (CO₂e) emitted per person to travel one kilometer. This includes both CO₂ and other greenhouse gases.
Data is sourced from Our World in Data, the UK Government’s Department for Energy Security and Net Zero, and The International Council on Clean Transportation, as of December 2022.
These figures should be interpreted as approximations, rather than exact numbers. There are many variables at play that determine the actual carbon footprint in any individual case, including vehicle type or model, occupancy, energy mix, and even weather.
Cruise Ships are the Most Carbon-Intensive Travel Method
According to these estimates, taking a cruise ship, flying domestically, and driving alone are some of the most carbon-intensive travel methods.
Cruise ships typically use heavy fuel oil, which is high in carbon content. The average cruise ship weighs between 70,000 to 180,000 metric tons, meaning they require large engines to get moving.
These massive vessels must also generate power for onboard amenities such as lighting, air conditioning, and entertainment systems.
Short-haul flights are also considered carbon-intensive due to the significant amount of fuel consumed during initial takeoff and climbing altitude, relative to a lower amount of cruising.
| Transportation method | CO₂ equivalent emissions per passenger km |
|---|---|
| Cruise Ship | 250 |
| Short-haul flight (i.e. within a U.S. state or European country) | 246 |
| Diesel car | 171 |
| Gas car | 170 |
| Medium-haul flight (i.e. international travel within Europe, or between U.S. states) | 151 |
| Long-haul flight (over 3,700 km, about the distance from LA to NY) | 147 |
| Motorbike | 113 |
| Bus (average) | 96 |
| Plug-in hybrid | 68 |
| Electric car | 47 |
| National rail | 35 |
| Tram | 28 |
| London Underground | 27 |
| Ferry (foot passenger) | 19 |
| Eurostar (International rail) | 4.5 |
Are EVs Greener?
Many experts agree that EVs produce a lower carbon footprint over time versus traditional internal combustion engine (ICE) vehicles.
However, the batteries in electric vehicles charge on the power that comes straight off the electrical grid—which in many places may be powered by fossil fuels. For that reason, the carbon footprint of an EV will depend largely on the blend of electricity sources used for charging.
There are also questions about how energy-intensive it is to build EVs compared to a comparable ICE vehicle.

-

 Debt1 week ago
How Debt-to-GDP Ratios Have Changed Since 2000
-

 Markets2 weeks ago
Ranked: The World’s Top Flight Routes, by Revenue
-

 Countries2 weeks ago
Population Projections: The World’s 6 Largest Countries in 2075
-

 Markets2 weeks ago
The Top 10 States by Real GDP Growth in 2023
-

 Demographics2 weeks ago
The Smallest Gender Wage Gaps in OECD Countries
-

 United States2 weeks ago
Where U.S. Inflation Hit the Hardest in March 2024
-

 Green2 weeks ago
Top Countries By Forest Growth Since 2001
-

 United States2 weeks ago
Ranked: The Largest U.S. Corporations by Number of Employees