Markets
5 Hidden Ways That Globalization is Changing
Globalization has been a powerful force in shaping modern human history.
The world economy has become increasingly connected and interdependent over recent decades, and conventional wisdom suggests that this will only continue in the years ahead.
But while it’s tempting to extrapolate the past effects of globalization into the future, such a leap may also be a mistake. That’s because there is growing evidence that globalization itself is quietly transforming – and how it ultimately evolves may be markedly different from what most business leaders might expect.
How Globalization is Changing
Today’s infographic highlights the most recent research about globalization from the McKinsey Global Institute, the business and economics research arm of McKinsey & Company.
Below are five major shifts that have gone mostly unnoticed, as well as the countries and companies that could benefit:

The findings of the report show that globalization is not static or constant, and that structural changes in the nature of globalization have been occurring in the background over the last decade or so.
>> View the Complete Report Here:
“Globalization in transition: The future of trade and value chains”
The impact that these shifts could have on the global economy is substantial: international trade already adds up to $22.4 trillion each year, or about 28% of global GDP. Even a minor change in this paradigm could affect the list of countries, corporations, and workers that stand to benefit.
The 5 Ways Globalization is Changing
The report looks into 23 different industry value chains in 43 different countries, representing 96% of global trade.
From that comprehensive data, five major structural shifts have been identified:
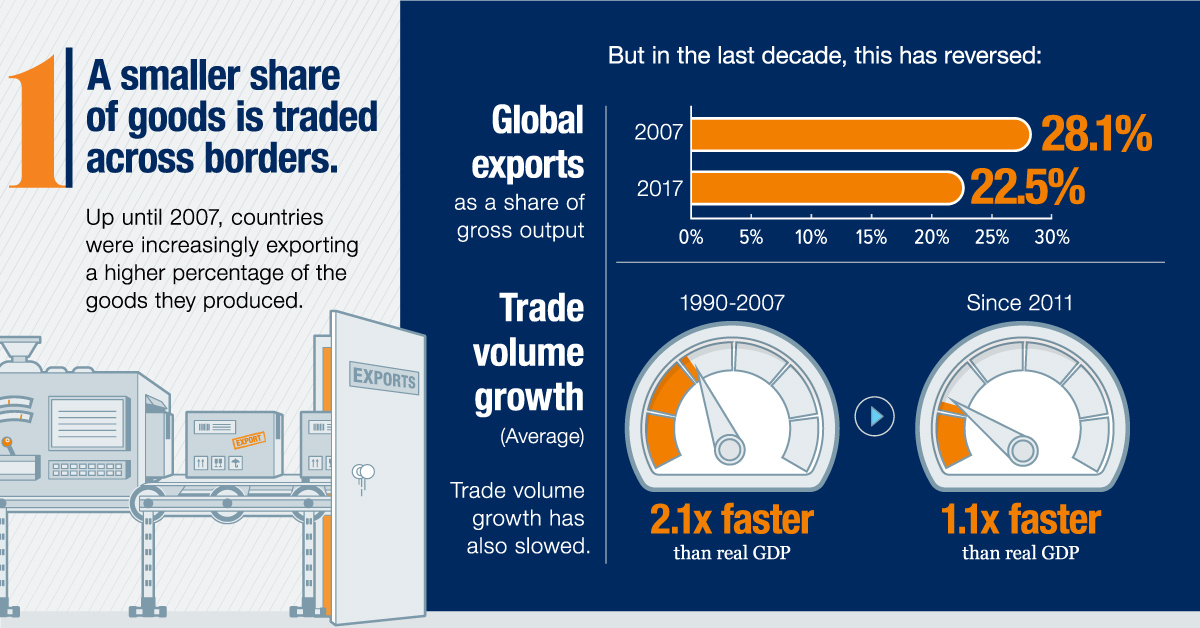
1. A smaller share of goods is traded across borders
Trade is still growing in absolute terms, but a smaller share of the physical goods made worldwide is now being traded. More specifically, during the span of 2007 to 2017, gross exports as a percentage of gross output decreased from 28.1% to 22.5% globally.
2. Services trade is growing 60% faster than goods trade
When we think of trade, we often focus on the trade of physical goods (i.e. autos, aerospace, oil). However, services are becoming increasingly important to the global economy – and if accounted for properly, it’s possible that the value of services is closer to $13.4 trillion, which is higher than the total goods trade.
3. Labor-cost arbitrage has become less important
It’s a common perception that trade flows are driven by companies searching for low-cost labor. However, in value chains today, only 18% of the goods trade is based strictly on labor-cost arbitrage.
4. R&D and innovation are becoming increasingly important
Companies are spending more on R&D and intangible assets such as brands, software, and IP as a percentage of overall revenue. This spending has increased from 5.4% to 13.1% of revenue over the period of 2000-2017.
5. Trade is becoming more concentrated within regions
The geography of global demand is changing as emerging markets consume a higher percentage of total goods. Since 2013, intraregional trade has increased by 2.7 percentage points – a reverse from the longstanding trend.
The mix of countries, companies, and workers that stand to gain in the next era is changing.
– McKinsey Global Institute
Why These Changes Matter
What types of countries are likely to benefit from these shifts, and which will face headwinds?
| Type of economy | Possible opportunities or challenges |
|---|---|
| Advanced economies | Strengths in innovation, services, and highly skilled talent put advanced economies in a strategic position to benefit from changes in globalization |
| Developing economies with close proximity to large consumer markets | As production moves closer to consumers, developing economies in close proximity can take advantage |
| Developing economies that are less connected | The window is narrowing for low-income countries to use labor-intensive exports as a development strategy |
Policy makers and business leaders must understand how the trade landscape is shifting so they can prepare for globalization’s next chapter and the opportunities and challenges it will present.


Markets
The European Stock Market: Attractive Valuations Offer Opportunities
On average, the European stock market has valuations that are nearly 50% lower than U.S. valuations. But how can you access the market?


European Stock Market: Attractive Valuations Offer Opportunities
Europe is known for some established brands, from L’Oréal to Louis Vuitton. However, the European stock market offers additional opportunities that may be lesser known.
The above infographic, sponsored by STOXX, outlines why investors may want to consider European stocks.
Attractive Valuations
Compared to most North American and Asian markets, European stocks offer lower or comparable valuations.
| Index | Price-to-Earnings Ratio | Price-to-Book Ratio |
|---|---|---|
| EURO STOXX 50 | 14.9 | 2.2 |
| STOXX Europe 600 | 14.4 | 2 |
| U.S. | 25.9 | 4.7 |
| Canada | 16.1 | 1.8 |
| Japan | 15.4 | 1.6 |
| Asia Pacific ex. China | 17.1 | 1.8 |
Data as of February 29, 2024. See graphic for full index names. Ratios based on trailing 12 month financials. The price to earnings ratio excludes companies with negative earnings.
On average, European valuations are nearly 50% lower than U.S. valuations, potentially offering an affordable entry point for investors.
Research also shows that lower price ratios have historically led to higher long-term returns.
Market Movements Not Closely Connected
Over the last decade, the European stock market had low-to-moderate correlation with North American and Asian equities.
The below chart shows correlations from February 2014 to February 2024. A value closer to zero indicates low correlation, while a value of one would indicate that two regions are moving in perfect unison.
| EURO STOXX 50 | STOXX EUROPE 600 | U.S. | Canada | Japan | Asia Pacific ex. China |
|
|---|---|---|---|---|---|---|
| EURO STOXX 50 | 1.00 | 0.97 | 0.55 | 0.67 | 0.24 | 0.43 |
| STOXX EUROPE 600 | 1.00 | 0.56 | 0.71 | 0.28 | 0.48 | |
| U.S. | 1.00 | 0.73 | 0.12 | 0.25 | ||
| Canada | 1.00 | 0.22 | 0.40 | |||
| Japan | 1.00 | 0.88 | ||||
| Asia Pacific ex. China | 1.00 |
Data is based on daily USD returns.
European equities had relatively independent market movements from North American and Asian markets. One contributing factor could be the differing sector weights in each market. For instance, technology makes up a quarter of the U.S. market, but health care and industrials dominate the broader European market.
Ultimately, European equities can enhance portfolio diversification and have the potential to mitigate risk for investors.
Tracking the Market
For investors interested in European equities, STOXX offers a variety of flagship indices:
| Index | Description | Market Cap |
|---|---|---|
| STOXX Europe 600 | Pan-regional, broad market | €10.5T |
| STOXX Developed Europe | Pan-regional, broad-market | €9.9T |
| STOXX Europe 600 ESG-X | Pan-regional, broad market, sustainability focus | €9.7T |
| STOXX Europe 50 | Pan-regional, blue-chip | €5.1T |
| EURO STOXX 50 | Eurozone, blue-chip | €3.5T |
Data is as of February 29, 2024. Market cap is free float, which represents the shares that are readily available for public trading on stock exchanges.
The EURO STOXX 50 tracks the Eurozone’s biggest and most traded companies. It also underlies one of the world’s largest ranges of ETFs and mutual funds. As of November 2023, there were €27.3 billion in ETFs and €23.5B in mutual fund assets under management tracking the index.
“For the past 25 years, the EURO STOXX 50 has served as an accurate, reliable and tradable representation of the Eurozone equity market.”
— Axel Lomholt, General Manager at STOXX
Partnering with STOXX to Track the European Stock Market
Are you interested in European equities? STOXX can be a valuable partner:
- Comprehensive, liquid and investable ecosystem
- European heritage, global reach
- Highly sophisticated customization capabilities
- Open architecture approach to using data
- Close partnerships with clients
- Part of ISS STOXX and Deutsche Börse Group
With a full suite of indices, STOXX can help you benchmark against the European stock market.
Learn how STOXX’s European indices offer liquid and effective market access.

-

 Economy2 days ago
Economic Growth Forecasts for G7 and BRICS Countries in 2024
The IMF has released its economic growth forecasts for 2024. How do the G7 and BRICS countries compare?
-

 Markets1 week ago
U.S. Debt Interest Payments Reach $1 Trillion
U.S. debt interest payments have surged past the $1 trillion dollar mark, amid high interest rates and an ever-expanding debt burden.
-

 United States2 weeks ago
Ranked: The Largest U.S. Corporations by Number of Employees
We visualized the top U.S. companies by employees, revealing the massive scale of retailers like Walmart, Target, and Home Depot.
-

 Markets2 weeks ago
The Top 10 States by Real GDP Growth in 2023
This graphic shows the states with the highest real GDP growth rate in 2023, largely propelled by the oil and gas boom.
-

 Markets2 weeks ago
Ranked: The World’s Top Flight Routes, by Revenue
In this graphic, we show the highest earning flight routes globally as air travel continued to rebound in 2023.
-

 Markets2 weeks ago
Ranked: The Most Valuable Housing Markets in America
The U.S. residential real estate market is worth a staggering $47.5 trillion. Here are the most valuable housing markets in the country.


-

 Misc1 week ago
How Hard Is It to Get Into an Ivy League School?
-

 Technology2 weeks ago
Ranked: Semiconductor Companies by Industry Revenue Share
-
Markets2 weeks ago
Ranked: The World’s Top Flight Routes, by Revenue
-

 Countries2 weeks ago
Population Projections: The World’s 6 Largest Countries in 2075
-
Markets2 weeks ago
The Top 10 States by Real GDP Growth in 2023
-

 Demographics2 weeks ago
The Smallest Gender Wage Gaps in OECD Countries
-

 Economy2 weeks ago
Where U.S. Inflation Hit the Hardest in March 2024
-

 Green2 weeks ago
Top Countries By Forest Growth Since 2001