Politics
Visualizing the World’s Top 25 Fleets of Combat Tanks


Visualizing the World’s Top 25 Fleets of Combat Tanks
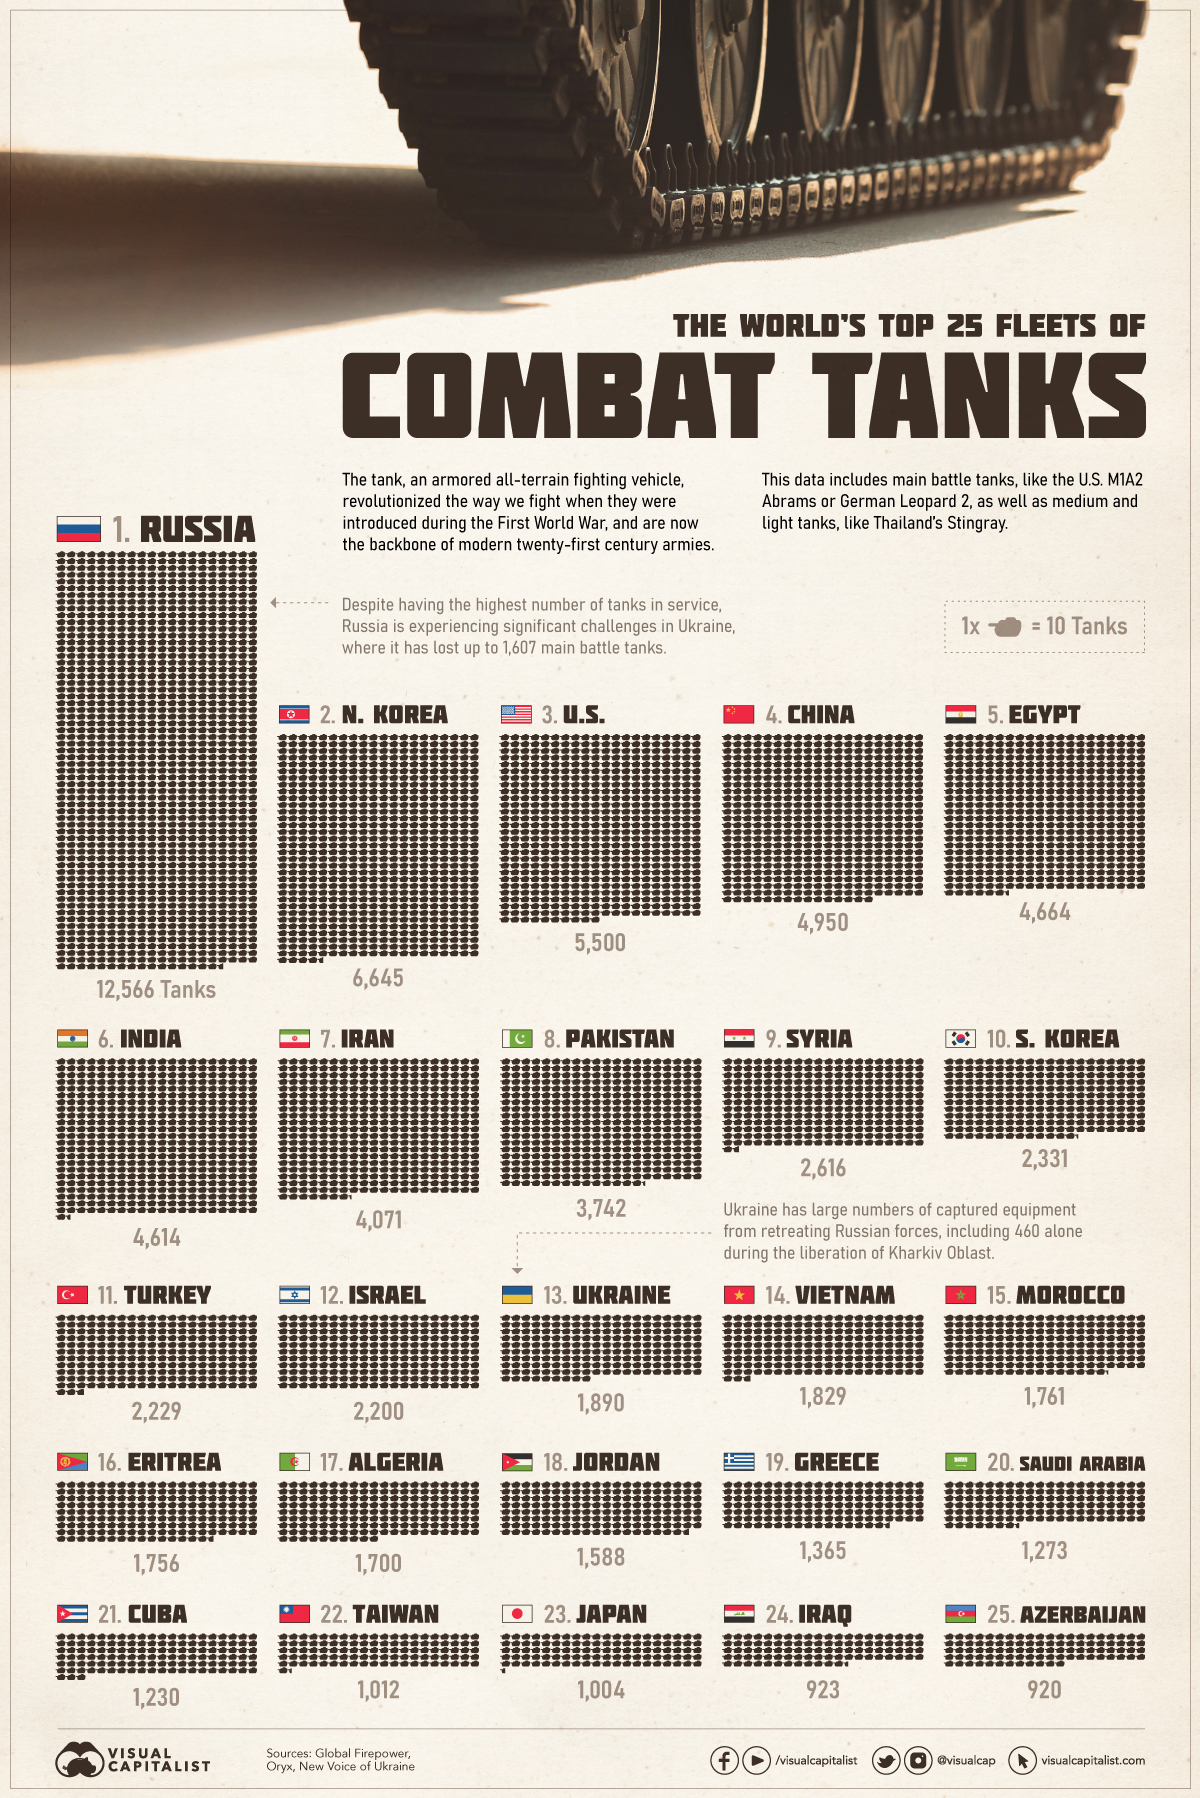
The tank, an armored all-terrain fighting vehicle, revolutionized the way we fight when introduced during the First World War. Since then, despite some commentators predicting the end of the tank era, they remain a cornerstone of 21st century armies.
Global Firepower has released their ranking of combat tank fleet sizes for 2023, which we’ve visualized in this infographic.
The ranking includes main battle tanks, like the U.S. M1A2 Abrams or the German Leopard 2, but also more lightly-armed medium and light tanks, like Thailand’s Stingray. The numbers do not include armored personnel carriers or infantry fighting vehicles.
Russia
Numbering 12,556 tanks, the Russian Federation has the largest fleet in their arsenal by far, from the workhorse T-72 series to the ultra-advanced T-14 Armata. This is more than the combined total of the number two and three spots, North Korea (6,645) and the U.S. (5,500).
But the headline number misses nuances in the composition of the Russian tank fleet.
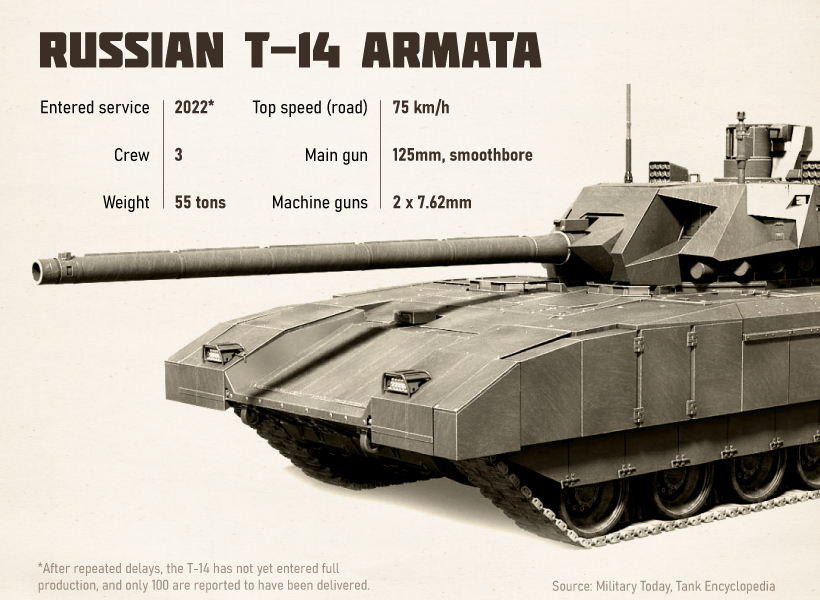
Of Russia’s nearly 13,000 active combat tanks, only a fraction are main battle tanks. A 2021 Russian source estimated that their operational main battle fleet was closer to 2,600 tanks, made up of T-72s, T-80s, and T-90s, with another 400 T-72 variants used as range tanks.
On top of that, only one-quarter of those are considered modern tanks—T-72B3/B3M, T-80-BVM, and T-90A/M—that is, fitted with up-to-date fire control systems and sighting. That’s why, on top of poor morale, inadequate logistics, and inflexible tactics, Russia has struggled to perform on the Ukrainian battlefield despite having more than six times the number of tanks (12,556 vs. 1,890).
According to a Pentagon official speaking in early November 2022, Russia has lost half of their tanks since their “special military operation” began on February 24, 2022. The conflict has also injured or killed thousands of civilians, displaced millions, and upended the post-Cold War security architecture.
North Korea
The world’s second-largest tank fleet belongs to North Korea, with a combat fleet of 6,645 tanks.
The Democratic People’s Republic of Korea has maintained armored capabilities since the Korean War (1950-1953) when their first armored unit, the 105th Armored Brigade, participated in the invasion of South Korea armed with 120 Soviet-made T-34/85 tanks.
After the war, the North Korean army rearmed with Soviet T-34/85s, and later with T-55s and Chinese-variant Type 59 tanks. Despite now being decades-old, these are likely still in service, alongside indigenous designs such as the Chonma-ho “Flying Horse” and the Pokpung-ho “Storm.”
Ultimately, these tank forces are considered to be no match for modern main battle tanks despite their numbers. One military blogger called them “weak and pathetic”—especially when compared to South Korea’s fourth-generation K2 Black Panther, considered one of the most advanced tanks in the world.
China
China’s People’s Liberation Army (PLA) recently accelerated fleet modernization plans at the 20th Party Congress, in anticipation of the army’s centenary in 2027, but they still have a ways to go.
Their fourth-place 4,950 combat tank fleet contains a mix of modern and obsolete tanks.
China’s most modern main battle tank, the third-generation Type 99, is a domestic design. Armed with a 125mm diameter main gun—slightly larger than the NATO standard 120mm—and 1,500hp diesel engine, it is tough and maneuverable. An upgraded variant, the Type 99A, debuted in the mid-2000s.
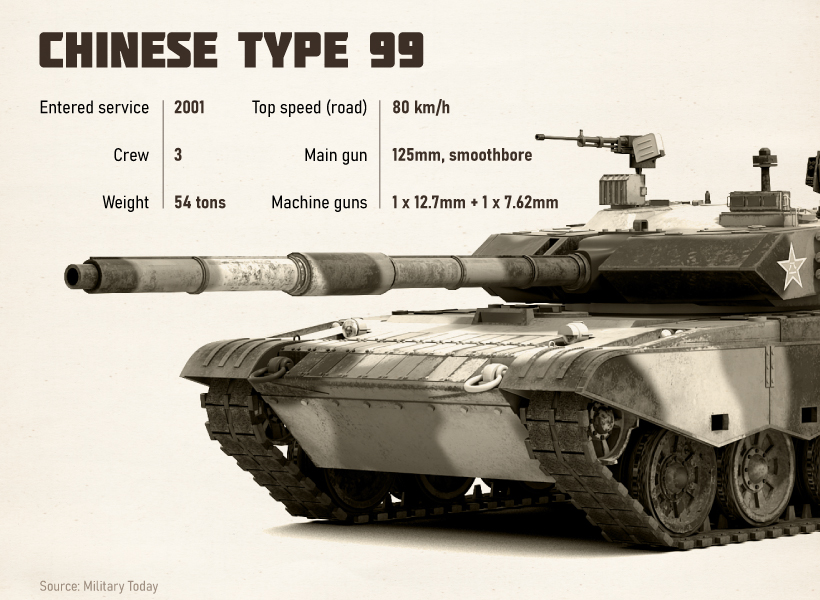
There is some speculation that the Type 99/99A could rival the U.S. M1 Abrams. However, it still falls short of fourth-generation designs, such as Russia’s T-14 Armata, South Korea’s K2 Black Panther, or Japan’s Type 10.
But thanks to a whopping $293 billion military budget, and significant industrial espionage, China’s defense industry is capable of producing military equipment at or near world-class standards, including tanks. The country even began testing unmanned tanks, including the Type 59 in 2018 and lightweight Type 15 in 2019.
Ukraine
Despite coming in at #13 with 1,890 tanks and initial predictions of a quick victory for Russian invaders, Ukrainian forces have successfully halted and then turned back their numerically superior foes.
Originally armed with upgraded Soviet-era T-64s, as well as donations of T-72s from Poland and Czechia, Ukraine’s tank forces have swelled thanks to captured military equipment left behind by fleeing Russian soldiers.
Oryx, a Dutch defense analysis website that has been tracking battlefield progress in Ukraine using open-source intelligence, estimates that 533 tanks, including several top-of-the-line T-90s, have been captured as of early 2023. According to a U.S. defense official, Ukraine may now have “more tanks in the battlefield than the Russians do.”
Arsenal of Democracy?
Looking ahead, Ukraine is asking for advanced Western main battle tanks, as it seeks to liberate the rest of its territory from Russia, including the Donbas and Crimea. NATO nations had been reluctant to take that step, as they were wary of further antagonizing Russia, but resistance seems to be diminishing.
On January 4, 2023, France agreed to deliver AMX-10 RC light tanks to Ukraine, the first Western country to do so. On January 6, the U.S. and Germany each agreed to deliver armored vehicles of their own, the Bradley and Marder, respectively.
And as another possible sign that sentiment has shifted, the UK has also said that it plans to donate a small number of Challenger 2 main battle tanks, while Poland has signaled their intention to donate Leopard 2 tanks (though the latter will need Germany’s permission to export).
As the spring campaign season approaches, we will see how these new weapons affect the balance of tank fleets both on and off the battlefield.


Economy
The Bloc Effect: International Trade with Geopolitical Allies on the Rise
Rising geopolitical tensions are shaping the future of international trade, but what is the effect on trading among G7 and BRICS countries?


The Bloc Effect: International Trade with Allies on the Rise
International trade has become increasingly fragmented over the last five years as countries have shifted to trading more with their geopolitical allies.
This graphic from The Hinrich Foundation, the first in a three-part series covering the future of trade, provides visual context to the growing divide in trade in G7 and pre-expansion BRICS countries, which are used as proxies for geopolitical blocs.
Trade Shifts in G7 and BRICS Countries
This analysis uses IMF data to examine differences in shares of exports within and between trading blocs from 2018 to 2023. For example, we looked at the percentage of China’s exports with other BRICS members as well as with G7 members to see how these proportions shifted in percentage points (pp) over time.
Countries traded nearly $270 billion more with allies in 2023 compared to 2018. This shift came at the expense of trade with rival blocs, which saw a decline of $314 billion.
Country Change in Exports Within Bloc (pp) Change in Exports With Other Bloc (pp)
🇮🇳 India 0.0 3.9
🇷🇺 Russia 0.7 -3.8
🇮🇹 Italy 0.8 -0.7
🇨🇦 Canada 0.9 -0.7
🇫🇷 France 1.0 -1.1
🇪🇺 EU 1.1 -1.5
🇩🇪 Germany 1.4 -2.1
🇿🇦 South Africa 1.5 1.5
🇺🇸 U.S. 1.6 -0.4
🇯🇵 Japan 2.0 -1.7
🇨🇳 China 2.1 -5.2
🇧🇷 Brazil 3.7 -3.3
🇬🇧 UK 10.2 0.5
All shifts reported are in percentage points. For example, the EU saw its share of exports to G7 countries rise from 74.3% in 2018 to 75.4% in 2023, which equates to a 1.1 percentage point increase.
The UK saw the largest uptick in trading with other countries within the G7 (+10.2 percentage points), namely the EU, as the post-Brexit trade slump to the region recovered.
Meanwhile, the U.S.-China trade dispute caused China’s share of exports to the G7 to fall by 5.2 percentage points from 2018 to 2023, the largest decline in our sample set. In fact, partly as a result of the conflict, the U.S. has by far the highest number of harmful tariffs in place.
The Russia-Ukraine War and ensuing sanctions by the West contributed to Russia’s share of exports to the G7 falling by 3.8 percentage points over the same timeframe.
India, South Africa, and the UK bucked the trend and continued to witness advances in exports with the opposing bloc.
Average Trade Shifts of G7 and BRICS Blocs
Though results varied significantly on a country-by-country basis, the broader trend towards favoring geopolitical allies in international trade is clear.
Bloc Change in Exports Within Bloc (pp) Change in Exports With Other Bloc (pp)
Average 2.1 -1.1
BRICS 1.6 -1.4
G7 incl. EU 2.4 -1.0
Overall, BRICS countries saw a larger shift away from exports with the other bloc, while for G7 countries the shift within their own bloc was more pronounced. This implies that though BRICS countries are trading less with the G7, they are relying more on trade partners outside their bloc to make up for the lost G7 share.
A Global Shift in International Trade and Geopolitical Proximity
The movement towards strengthening trade relations based on geopolitical proximity is a global trend.
The United Nations categorizes countries along a scale of geopolitical proximity based on UN voting records.
According to the organization’s analysis, international trade between geopolitically close countries rose from the first quarter of 2022 (when Russia first invaded Ukraine) to the third quarter of 2023 by over 6%. Conversely, trade with geopolitically distant countries declined.
The second piece in this series will explore China’s gradual move away from using the U.S. dollar in trade settlements.
Visit the Hinrich Foundation to learn more about the future of geopolitical trade

-

 Economy2 days ago
Economic Growth Forecasts for G7 and BRICS Countries in 2024
The IMF has released its economic growth forecasts for 2024. How do the G7 and BRICS countries compare?
-

 United States2 weeks ago
Ranked: The Largest U.S. Corporations by Number of Employees
We visualized the top U.S. companies by employees, revealing the massive scale of retailers like Walmart, Target, and Home Depot.
-

 Economy2 weeks ago
Where U.S. Inflation Hit the Hardest in March 2024
We visualized product categories that saw the highest % increase in price due to U.S. inflation as of March 2024.
-

 Economy4 weeks ago
G20 Inflation Rates: Feb 2024 vs COVID Peak
We visualize inflation rates across G20 countries as of Feb 2024, in the context of their COVID-19 pandemic peak.
-

 Economy1 month ago
Mapped: Unemployment Claims by State
This visual heatmap of unemployment claims by state highlights New York, California, and Alaska leading the country by a wide margin.
-

 Economy2 months ago
Confidence in the Global Economy, by Country
Will the global economy be stronger in 2024 than in 2023?


-

 Mining1 week ago
Gold vs. S&P 500: Which Has Grown More Over Five Years?
-

 Markets2 weeks ago
Ranked: The Most Valuable Housing Markets in America
-

 Money2 weeks ago
Which States Have the Highest Minimum Wage in America?
-

 AI2 weeks ago
Ranked: Semiconductor Companies by Industry Revenue Share
-

 Markets2 weeks ago
Ranked: The World’s Top Flight Routes, by Revenue
-

 Countries2 weeks ago
Population Projections: The World’s 6 Largest Countries in 2075
-

 Markets2 weeks ago
The Top 10 States by Real GDP Growth in 2023
-

 Demographics2 weeks ago
The Smallest Gender Wage Gaps in OECD Countries