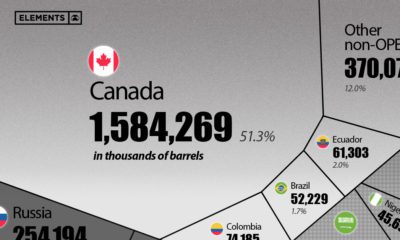

This visualization breaks down U.S. oil imports by country for 2021, showing the split by OPEC and non-OPEC nations.


Just how powerful are nuclear bombs? Here's a look at the top 10 largest nuclear explosions.
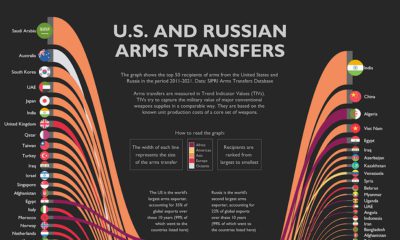

The U.S. and Russia combined for 57% of all global arms transfers in the last decade. This graphic highlights their 50 biggest trade partners.
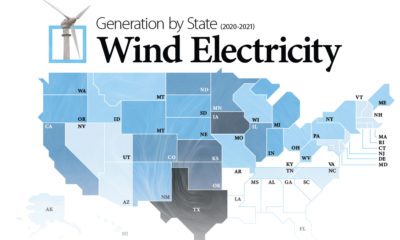

Wind energy is the largest source of renewable electricity in North America. This graphic maps U.S. states by wind electricity generation.


Explore everything about Carlin-type gold deposits in this infographic.
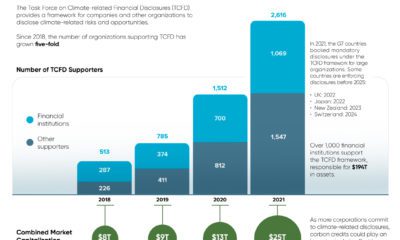

The number of organizations supporting TCFD climate disclosures has grown five-fold since 2018. (Sponsored Content)
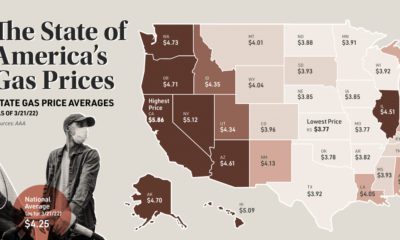

This map looks at gas prices across various states, and historical context for today's sky-high prices at the pump.
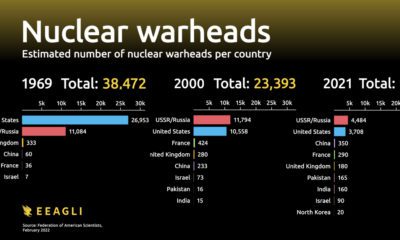

Nine countries currently possess all the world's nuclear warheads. This animation visualizes how the global nuclear arsenal has changed since 1945.


2020 plant-based alternatives sales surpassed $7 billion in the U.S. alone. How did this explosion in plant-based alternatives start?
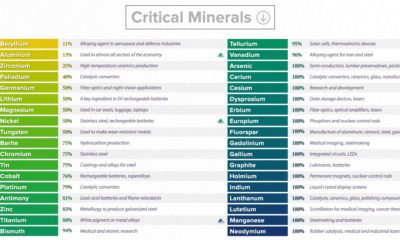

This graphic lists all minerals that are deemed critical to both the economic and national security of the United States.


 Creator Program