

How big is the world’s nuclear arsenal? Here are the stockpiles of the nine countries with nuclear weapons.
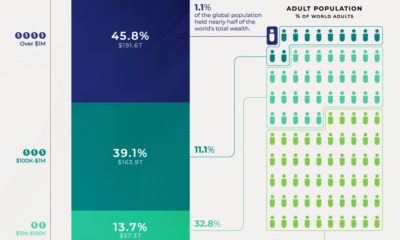

Global wealth at the end of 2020 was about $418 trillion. Here's a breakdown of the global wealth distribution among the adult population.
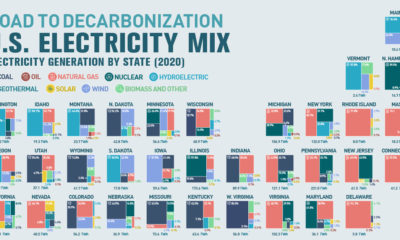

Can America become carbon-free by 2035? This graphic breaks down the United States’ electricity mix, by state.
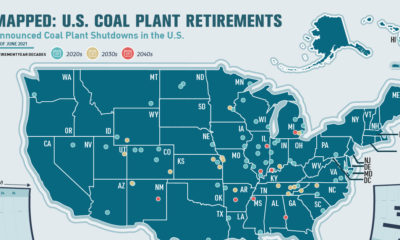

This infographic highlights announced coal plant closures in the U.S. and how much power will be affected.
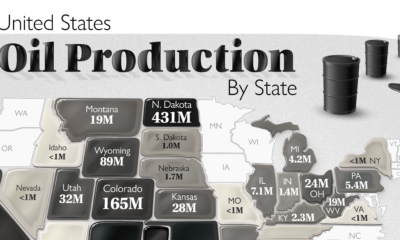

The U.S. is the largest oil producer in the world. Here we map the share of oil production in the country by all 50 states in...
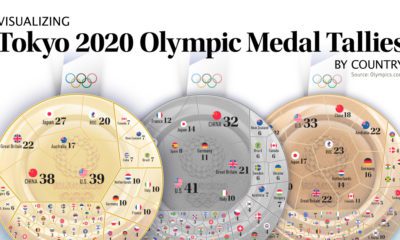

After 17 days and 339 events, the Tokyo Olympics have come to an end. Here we visualize the final medal tallies for every participating country.
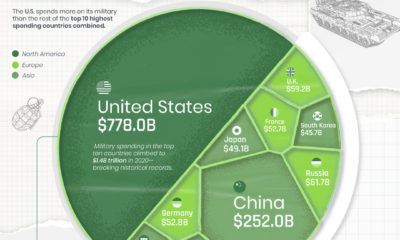

The U.S. is well known for its enormous defense budget, but how does it compare to the rest of the world's military spending?
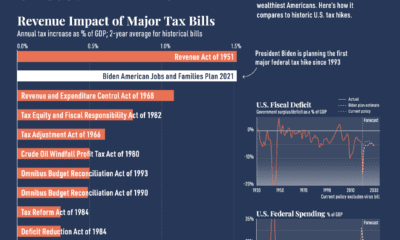

President Biden is set to inject trillions into the economy through higher taxes. Here’s how the tax hikes compares to historic U.S. tax increases.
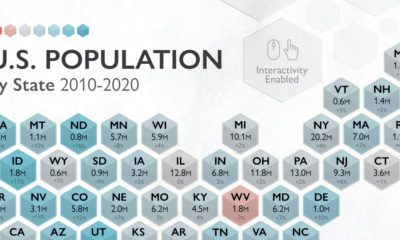

The U.S. saw 7.4% population growth in the past decade, the lowest it's been since the 1930s. How does population by state look today?
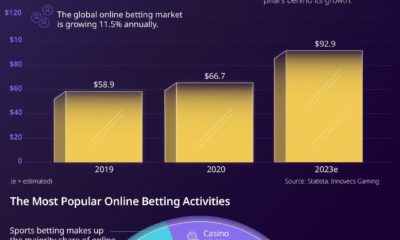

The global online and sports betting industry is expanding rapidly due to loosening regulation and the growing digitization of the world.