Road to Decarbonization: The United States Electricity Mix
Road to Decarbonization: The United States Electricity Mix
The U.S. response to climate change and decarbonization is ramping up, and putting a focus on the country’s electricity mix.
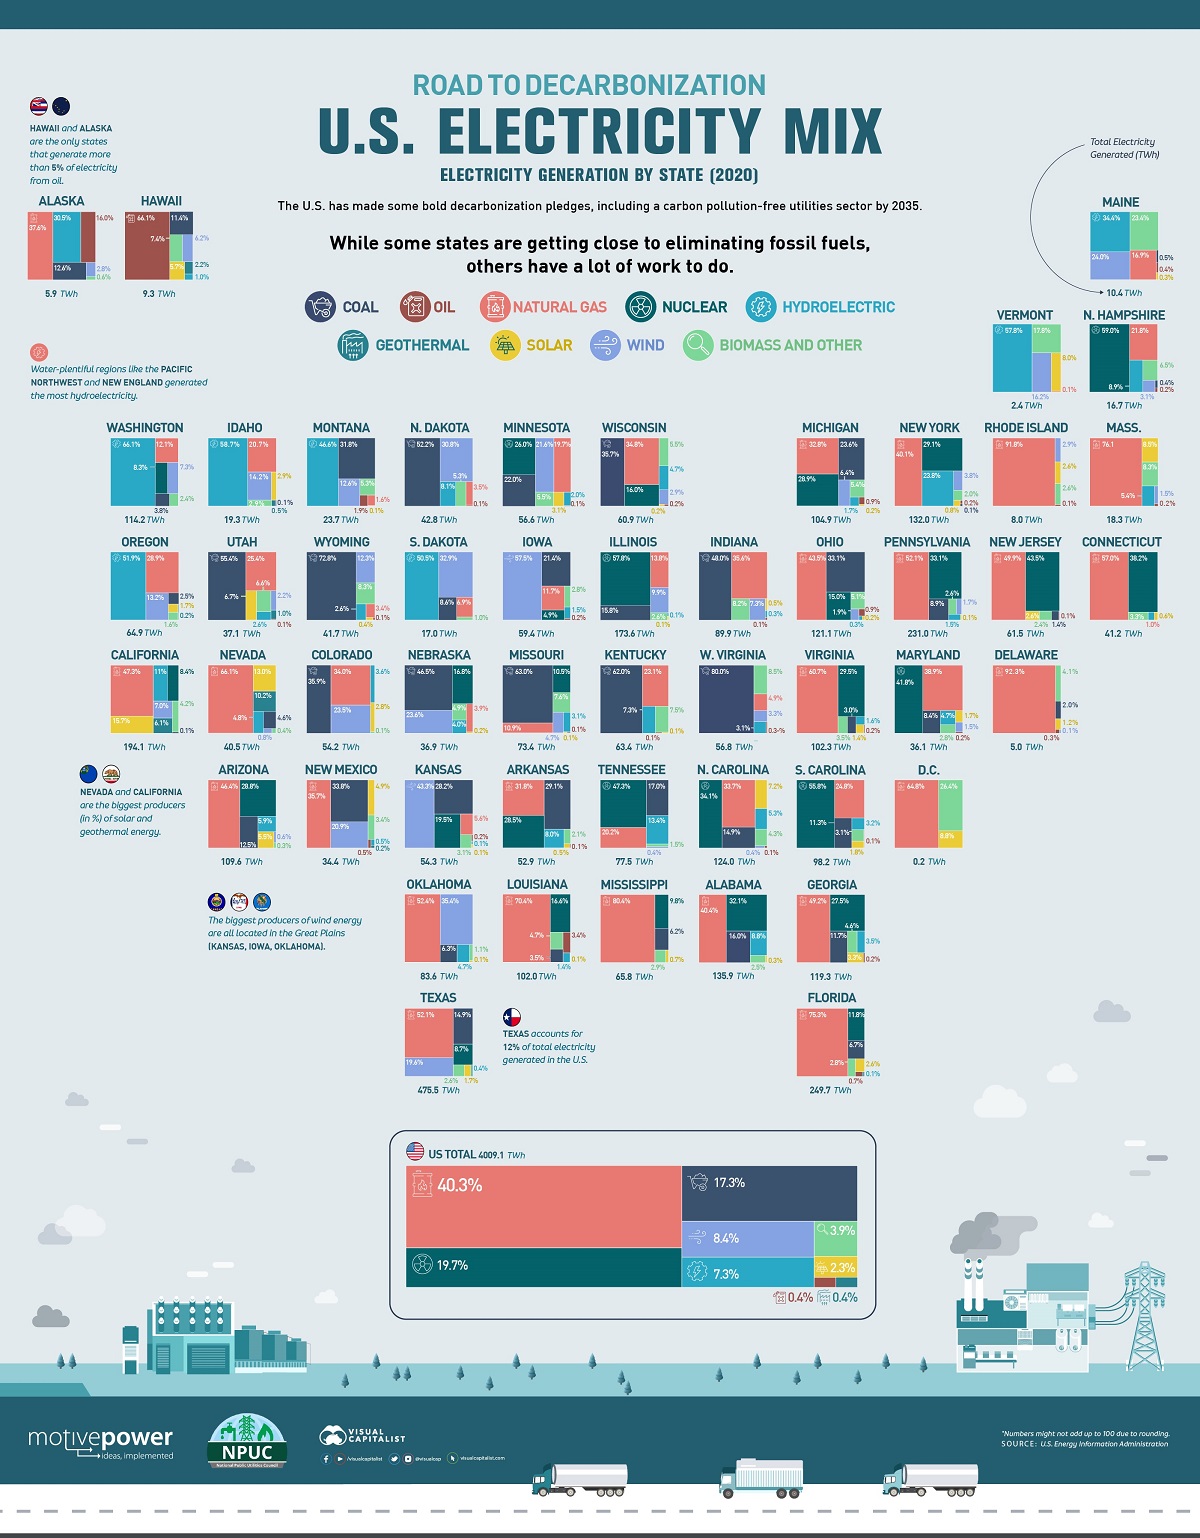
As pressure has increased for near-term and immediate action after the UN’s latest IPCC report on climate change, major economies are starting to make bolder pledges. For the United States, that includes a carbon pollution-free utilities sector by 2035.
But with 50 states and even more territories—each with different energy sources readily available and utilized—some parts of the U.S. are a lot closer to carbon-free electricity than others.
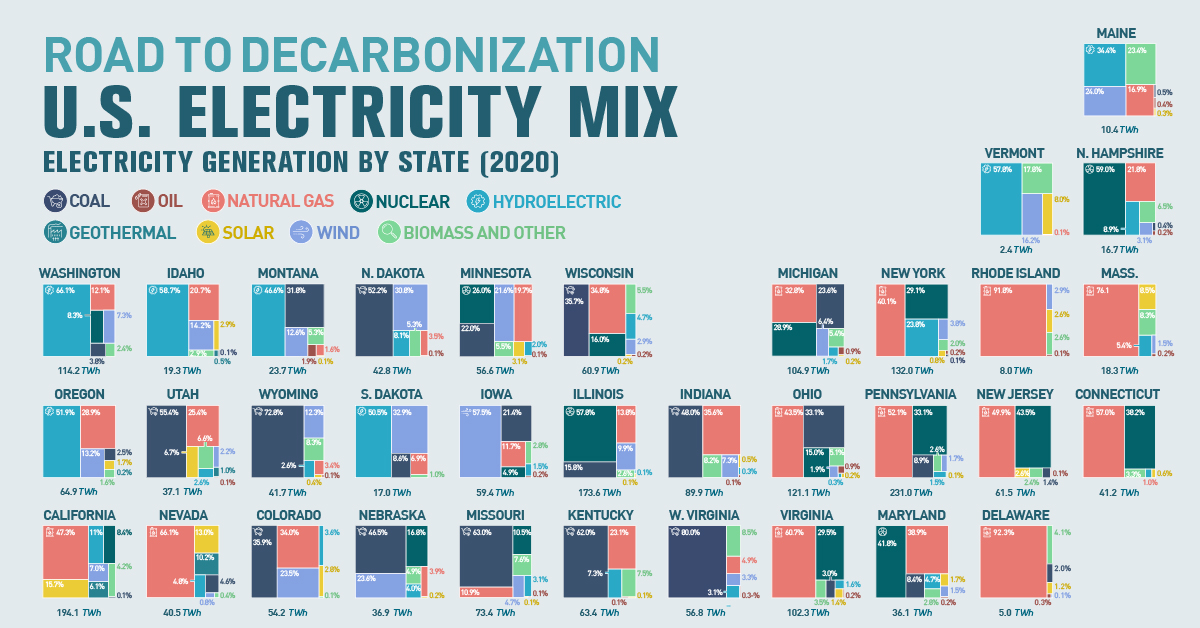
How does each state’s electricity mix compare? This infographic from the National Public Utilities Council highlights the energy sources used for electricity in U.S. states during 2020, using data from the U.S. Energy Information Administration.
The U.S. Electricity Generation Mix By State
How does the United States generate electricity currently?
Over the course of 2020, the U.S. generated 4,009 TWh of electricity, with the majority coming from fossil fuels. Natural gas (40.3%) was the biggest source of electricity for the country, accounting for more than nuclear (19.7%) and coal (17.3%) combined.
Including nuclear energy, non-fossil fuels made up 41.9% of U.S. electricity generation in 2020. The biggest sources of renewable electricity in the U.S. were wind (8.4%) and hydro (7.3%).
But on a state-by-state breakdown, we can see just how different the electricity mix is across the country (rounded to the nearest percentage).
| State (Electricity Source 2020) | Coal | Gas | Oil | Nuclear | Hydro | Geothermal | Solar | Wind | Biomass and Other |
|---|---|---|---|---|---|---|---|---|---|
| Alabama | 16% | 40% | 0% | 32% | 9% | 0% | 0% | 0% | 3% |
| Alaska | 13% | 38% | 16% | 0% | 31% | 0% | 0% | 3% | 1% |
| Arizona | 13% | 46% | 0% | 29% | 6% | 0% | 6% | 1% | 0% |
| Arkansas | 29% | 32% | 0% | 29% | 8% | 0% | 1% | 0% | 2% |
| California | 0% | 47% | 0% | 8% | 11% | 6% | 16% | 7% | 4% |
| Colorado | 36% | 34% | 0% | 0% | 4% | 0% | 3% | 24% | 0% |
| Connecticut | 0% | 57% | 0% | 38% | 1% | 0% | 1% | 0% | 3% |
| D.C. | 0% | 65% | 0% | 0% | 0% | 0% | 9% | 0% | 26% |
| Delaware | 2% | 92% | 0% | 0% | 0% | 0% | 1% | 0% | 4% |
| Florida | 7% | 75% | 1% | 12% | 0% | 0% | 3% | 0% | 3% |
| Georgia | 12% | 49% | 0% | 28% | 4% | 0% | 3% | 0% | 5% |
| Hawaii | 11% | 0% | 66% | 0% | 1% | 2% | 6% | 6% | 7% |
| Idaho | 0% | 21% | 0% | 0% | 59% | 1% | 3% | 14% | 3% |
| Illinois | 16% | 14% | 0% | 58% | 0% | 0% | 0% | 10% | 3% |
| Indiana | 48% | 36% | 0% | 0% | 0% | 0% | 1% | 7% | 8% |
| Iowa | 21% | 12% | 0% | 5% | 2% | 0% | 0% | 58% | 3% |
| Kansas | 28% | 6% | 0% | 20% | 0% | 0% | 0% | 43% | 3% |
| Kentucky | 62% | 23% | 0% | 0% | 7% | 0% | 0% | 0% | 8% |
| Louisiana | 4% | 70% | 3% | 17% | 1% | 0% | 0% | 0% | 5% |
| Maine | 1% | 17% | 0% | 0% | 34% | 0% | 0% | 24% | 23% |
| Maryland | 8% | 39% | 0% | 42% | 5% | 0% | 2% | 2% | 3% |
| Massachusetts | 0% | 76% | 0% | 0% | 5% | 0% | 9% | 2% | 8% |
| Michigan | 24% | 33% | 1% | 29% | 2% | 0% | 0% | 6% | 5% |
| Minnesota | 22% | 20% | 0% | 26% | 2% | 0% | 3% | 22% | 6% |
| Mississippi | 6% | 80% | 0% | 10% | 0% | 0% | 1% | 0% | 3% |
| Missouri | 63% | 11% | 0% | 11% | 3% | 0% | 0% | 5% | 8% |
| Montana | 32% | 2% | 2% | 0% | 47% | 0% | 0% | 13% | 5% |
| Nebraska | 47% | 4% | 0% | 17% | 4% | 0% | 0% | 24% | 5% |
| Nevada | 5% | 66% | 0% | 0% | 5% | 10% | 13% | 1% | 0% |
| New Hampshire | 0% | 22% | 0% | 59% | 9% | 0% | 0% | 3% | 7% |
| New Jersey | 1% | 50% | 0% | 44% | 0% | 0% | 3% | 0% | 2% |
| New Mexico | 34% | 36% | 1% | 0% | 1% | 0% | 5% | 21% | 3% |
| New York | 0% | 40% | 0% | 29% | 24% | 0% | 1% | 4% | 2% |
| North Carolina | 15% | 34% | 0% | 34% | 5% | 0% | 7% | 0% | 4% |
| North Dakota | 52% | 4% | 0% | 0% | 8% | 0% | 0% | 31% | 5% |
| Ohio | 33% | 44% | 1% | 15% | 0% | 0% | 0% | 2% | 5% |
| Oklahoma | 6% | 52% | 0% | 0% | 5% | 0% | 0% | 35% | 1% |
| Oregon | 3% | 29% | 0% | 0% | 52% | 0% | 2% | 13% | 2% |
| Pennsylvania | 9% | 52% | 0% | 33% | 2% | 0% | 0% | 2% | 3% |
| Rhode Island | 0% | 92% | 0% | 0% | 0% | 0% | 3% | 3% | 3% |
| South Carolina | 11% | 25% | 0% | 56% | 3% | 0% | 2% | 0% | 3% |
| South Dakota | 9% | 7% | 0% | 0% | 51% | 0% | 0% | 33% | 1% |
| Tennessee | 17% | 20% | 0% | 47% | 13% | 0% | 0% | 0% | 2% |
| Texas | 15% | 52% | 0% | 9% | 0% | 0% | 2% | 20% | 3% |
| Utah | 55% | 25% | 0% | 0% | 3% | 1% | 7% | 2% | 7% |
| Vermont | 0% | 0% | 0% | 0% | 58% | 0% | 8% | 16% | 18% |
| Virginia | 3% | 61% | 0% | 30% | 2% | 0% | 1% | 0% | 4% |
| Washington | 4% | 12% | 0% | 8% | 66% | 0% | 0% | 7% | 2% |
| West Virginia | 80% | 5% | 0% | 0% | 3% | 0% | 0% | 3% | 9% |
| Wisconsin | 36% | 35% | 0% | 16% | 5% | 0% | 0% | 3% | 6% |
| Wyoming | 73% | 3% | 0% | 0% | 3% | 0% | 0% | 12% | 8% |
At a glance, regional availability of a fuel source and historical use is clear.
For example, coal is the most-used electricity source in West Virginia, Kentucky, and Wyoming, historical coal rich regions and economies.
On the flip side, the Pacific Northwest and New England generated the most hydroelectricity, and the biggest producers of wind energy were all located in the Great Plains. Even the biggest percentage producers of solar and geothermal energy, California and Nevada, have plenty of access to sunlight and geothermal activity.
The Changing Electricity Landscape
But for the U.S. to reach its ambitious carbon-free goal by 2035, the biggest impact will need to come from the biggest electricity producers.
That title currently goes to Texas, which generated 12% of total U.S. electricity in 2020. Despite being the most populous state, California generated less than half Texas’ output, and less than both Florida and Pennsylvania.
| State | Electricity Generated 2020 (TWh) |
|---|---|
| Texas | 475.5 |
| Florida | 249.7 |
| Pennsylvania | 231.0 |
| California | 194.1 |
| Illinois | 173.6 |
| Alabama | 135.9 |
| New York | 132.0 |
| North Carolina | 124.0 |
| Ohio | 121.1 |
| Georgia | 119.3 |
| Washington | 114.2 |
| Arizona | 109.6 |
| Michigan | 104.9 |
| Virginia | 102.3 |
| Louisiana | 102.0 |
| South Carolina | 98.2 |
| Indiana | 89.9 |
| Oklahoma | 83.6 |
| Tennessee | 77.5 |
| Missouri | 73.4 |
| Mississippi | 65.8 |
| Oregon | 64.9 |
| Kentucky | 63.4 |
| New Jersey | 61.5 |
| Wisconsin | 61.0 |
| Iowa | 59.4 |
| West Virginia | 56.8 |
| Minnesota | 56.6 |
| Kansas | 54.3 |
| Colorado | 54.2 |
| Arkansas | 52.9 |
| North Dakota | 42.8 |
| Wyoming | 41.7 |
| Connecticut | 41.2 |
| Nevada | 40.5 |
| Utah | 37.1 |
| Nebraska | 36.9 |
| Maryland | 36.1 |
| New Mexico | 34.4 |
| Montana | 23.7 |
| Idaho | 19.3 |
| Massachusetts | 18.3 |
| South Dakota | 17.0 |
| New Hampshire | 16.7 |
| Maine | 10.4 |
| Hawaii | 9.3 |
| Rhode Island | 8.0 |
| Alaska | 5.9 |
| Delaware | 5.0 |
| Vermont | 2.4 |
| D.C. | 0.2 |
So although it’s positive that many states in the Pacific Northwest and New England have more plentiful non-fossil fuel electricity, their overall impact on the total U.S. picture is lessened.
Still, more and more states (and countries) are increasing their efforts and ambitions to decarbonize, and that progress makes it easier and more affordable over time. States that might struggle to attain carbon-free electricity, or where costs are too high, face less hurdles as technology improves and subsidies increase.
And with most major U.S. based utilities focusing on improving their ESG reporting and keeping up with decarbonization pledges of their own, the total electricity mix is expected to shift rapidly over the next decade.
National Public Utilities Council is the go-to resource for all things decarbonization in the utilities industry. Learn more.

-

 Sponsored3 years ago
More Than Precious: Silver’s Role in the New Energy Era (Part 3 of 3)
Long known as a precious metal, silver in solar and EV technologies will redefine its role and importance to a greener economy.
-
 Sponsored7 years ago
The History and Evolution of the Video Games Market
Everything from Pong to the rise of mobile gaming and AR/VR. Learn about the $100 billion video games market in this giant infographic.
-
 Sponsored8 years ago
The Extraordinary Raw Materials in an iPhone 6s
Over 700 million iPhones have now been sold, but the iPhone would not exist if it were not for the raw materials that make the technology…
-
 Sponsored8 years ago
The Industrial Internet, and How It’s Revolutionizing Mining
The convergence of the global industrial sector with big data and the internet of things, or the Industrial Internet, will revolutionize how mining works.