Politics
Arms Transfers: U.S. and Russia’s Biggest Trading Partners
Article/Editing:
Arms Transfers: U.S. and Russia’s Biggest Trading Partners
The increase in conflicts worldwide, including in Ukraine and the Middle East, has shifted global focus back onto arms transfers between countries.
For decades, countries proficient in arms manufacturing have supplied weapons to other countries in demand of them. At the helm of these trades are the U.S. and Russia, which have accounted for 57% of all international arms trades in the last 10 years.
So who are the largest importers of arms from these two countries, and what is the military value of these trades?
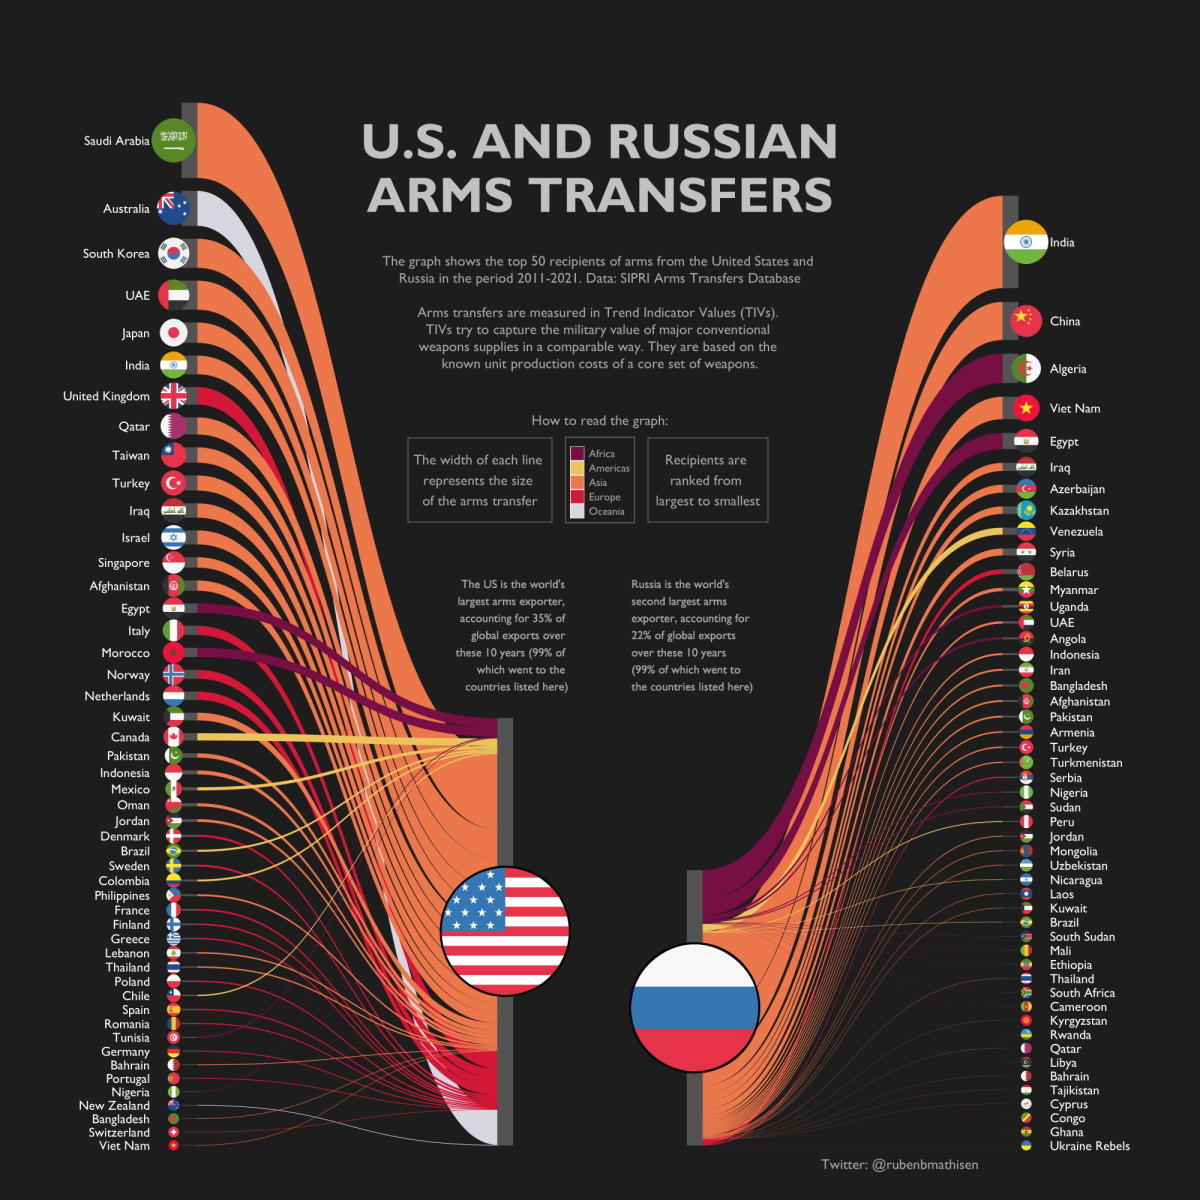
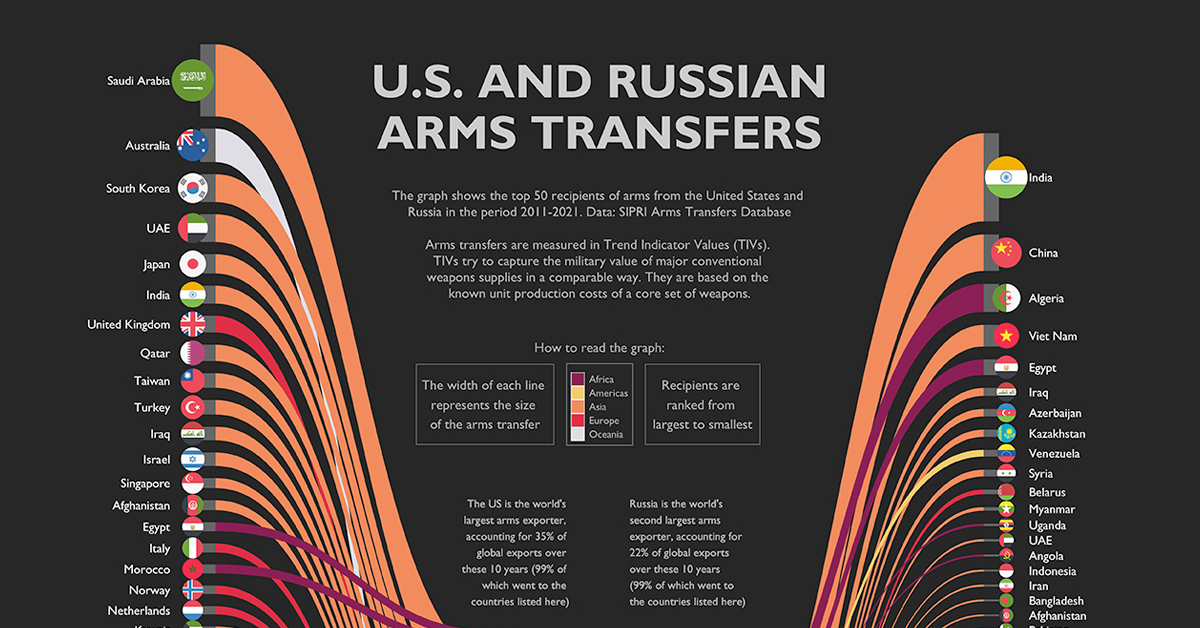
With the help of data from the Stockholm International Peace Research Institute (SIPRI) arms transfer database, the above infographic by Ruben Berge Mathisen visualizes the top 50 biggest arms recipients by value for both the U.S. and Russia in the last decade.
The Military Valuation of Arms Transfers
The military valuation of arms is measured in terms of trend-indicator values (TIV). This valuation reflects the military capability of a particular item rather than its financial value.
Every weapon that falls under the conventional definition of major arms is allotted a TIV. The following are the most common weapons and components to be assigned a TIV.
- Aircraft and armored vehicles
- Artillery (>100mm in caliber)
- Sensors and guided missiles, large air defense guns, torpedoes, and bombs
- 100mm caliber artillery-armed ships (>100-tonne displacement)
- Reconnaissance satellites and air refueling systems
Instead of focusing on budget, examining TIV makes it easier to measure trends in the flow of arms between particular countries and regions over time, essentially creating a military capability price index.
Biggest Recipients of U.S. Armaments
The United States is the largest exporter of arms globally, responsible for 35% of global exports over the last 10 years to about 130 nations.
Most recently, the biggest market for U.S. arms sales has been in the Middle East, with Saudi Arabia being the most prominent recipient of weapons. Over the last decade, the country has purchased 24% of total U.S. arms exports, with components worth over 18 billion TIVs.
Here is a look at the top 50 recipients of arms from the United States:
| U.S. Arms Transfer Recipient | Continent | TIV (Millions) |
|---|---|---|
| 🇸🇦 Saudi Arabia | Asia | 18,641 |
| 🇦🇺 Australia | Oceania | 8,668 |
| 🇰🇷 South Korea | Asia | 7,207 |
| 🇦🇪 UAE | Asia | 7,190 |
| 🇯🇵 Japan | Asia | 5,026 |
| 🇮🇳 India | Asia | 4,614 |
| 🇬🇧 United Kingdom | Europe | 4,332 |
| 🇶🇦 Qatar | Asia | 4,235 |
| 🇹🇼 Taiwan | Asia | 3,789 |
| 🇹🇷 Turkey | Asia | 3,722 |
| 🇮🇶 Iraq | Asia | 3,532 |
| 🇮🇱 Israel | Asia | 3,460 |
| 🇸🇬 Singapore | Asia | 2,571 |
| 🇦🇫 Afghanistan | Asia | 2,547 |
| 🇪🇬 Egypt | Africa | 2,334 |
| 🇮🇹 Italy | Europe | 2,281 |
| 🇲🇦 Morocco | Africa | 2,281 |
| 🇳🇴 Norway | Europe | 2,196 |
| 🇳🇱 Netherlands | Europe | 2,060 |
| 🇰🇼 Kuwait | Asia | 1,900 |
| 🇨🇦 Canada | Americas | 1,806 |
| 🇵🇰 Pakistan | Asia | 1,070 |
| 🇮🇩 Indonesia | Asia | 982 |
| 🇲🇽 Mexico | Americas | 782 |
| 🇴🇲 Oman | Asia | 779 |
| 🇯🇴 Jordan | Asia | 675 |
| 🇩🇰 Denmark | Europe | 548 |
| 🇧🇷 Brazil | Americas | 510 |
| 🇸🇪 Sweden | Europe | 505 |
| 🇨🇴 Colombia | Americas | 472 |
| 🇵🇭 Philippines | Asia | 450 |
| 🇫🇷 France | Europe | 438 |
| 🇫🇮 Finland | Europe | 389 |
| 🇬🇷 Greece | Europe | 359 |
| 🇱🇧 Lebanon | Asia | 350 |
| 🇹🇭 Thailand | Asia | 342 |
| 🇵🇱 Poland | Europe | 336 |
| 🇨🇱 Chile | Americas | 335 |
| 🇪🇸 Spain | Europe | 292 |
| 🇷🇴 Romania | Europe | 275 |
| 🇹🇳 Tunisia | Africa | 251 |
| 🇩🇪 Germany | Europe | 221 |
| 🇧🇭 Bahrain | Asia | 187 |
| 🇵🇹 Portugal | Europe | 179 |
| 🇳🇬 Nigeria | Africa | 154 |
| 🇳🇿 New Zealand | Oceania | 150 |
| 🇧🇩 Bangladesh | Asia | 123 |
| 🇨🇭 Switzerland | Europe | 117 |
| 🇻🇳 Vietnam | Asia | 108 |
| 🇦🇷 Argentina | Americas | 103 |
The U.S. remains the biggest global exporter of weapons globally, however, sales of military equipment to foreign countries dipped by 21% over the previous fiscal year, dropping from $175 billion in 2020 to $138 billion in 2021.
Biggest Recipients of Russian Armaments
Russia, the world’s second-largest arms dealer, was responsible for 22% of global arms exports between 2011 and 2021.
In terms of TIVs, India remains the biggest importer of Russian weapons by a wide margin. India’s dependency on Russian-made arms is driven by its fight to quell the military assertiveness of China on one side and its constant skirmishes along the Pakistani border on the other.
But despite the continued support of Russia and its President by the Indian Prime Minister, even in the wake of Russia’s war on Ukraine, some reports have shown that India has been looking elsewhere for arms in the last few years.
Let’s take a look at some of the other biggest importers of Russian arms around the world:
| Russian Arms Transfer Recipient | Continent | TIV (Millions) |
|---|---|---|
| 🇮🇳 India | Asia | 22,869 |
| 🇨🇳 China | Asia | 9,419 |
| 🇩🇿 Algeria | Africa | 7,235 |
| 🇻🇳 Vietnam | Asia | 5,554 |
| 🇪🇬 Egypt | Africa | 3,998 |
| 🇮🇶 Iraq | Asia | 2,015 |
| 🇦🇿 Azerbaijan | Asia | 1,967 |
| 🇰🇿 Kazakhstan | Asia | 1,841 |
| 🇻🇪 Venezuela | Americas | 1,743 |
| 🇸🇾 Syria | Asia | 1,729 |
| 🇧🇾 Belarus | Europe | 1,190 |
| 🇲🇲 Myanmar | Asia | 856 |
| 🇺🇬 Uganda | Africa | 611 |
| 🇦🇪 UAE | Asia | 578 |
| 🇦🇴 Angola | Africa | 501 |
| 🇮🇩 Indonesia | Asia | 490 |
| 🇮🇷 Iran | Asia | 476 |
| 🇧🇩 Bangladesh | Asia | 454 |
| 🇦🇫 Afghanistan | Asia | 441 |
| 🇵🇰 Pakistan | Asia | 437 |
| 🇦🇲 Armenia | Asia | 373 |
| 🇹🇷 Turkey | Asia | 344 |
| 🇹🇲 Turkmenistan | Asia | 307 |
| 🇷🇸 Serbia | Europe | 296 |
| 🇳🇬 Nigeria | Africa | 249 |
| 🇸🇩 Sudan | Africa | 244 |
| 🇵🇪 Peru | Americas | 221 |
| 🇯🇴 Jordan | Asia | 204 |
| 🇲🇳 Mongolia | Asia | 171 |
| 🇺🇿 Uzbekistan | Asia | 156 |
| 🇳🇮 Nicaragua | Americas | 121 |
| 🇱🇦 Laos | Asia | 118 |
| 🇰🇼 Kuwait | Asia | 113 |
| 🇧🇷 Brazil | Americas | 98 |
| 🇸🇸 South Sudan | Africa | 82 |
| 🇲🇱 Mali | Africa | 73 |
| 🇪🇹 Ethiopia | Africa | 69 |
| 🇹🇭 Thailand | Asia | 68 |
| 🇿🇦South Africa | Africa | 50 |
| 🇨🇲 Cameroon | Africa | 45 |
| 🇰🇬 Kyrgyzstan | Asia | 41 |
| 🇷🇼 Rwanda | Africa | 41 |
| 🇶🇦 Qatar | Asia | 40 |
| 🇱🇾 Libya | Africa | 36 |
| 🇧🇭 Bahrain | Asia | 31 |
| 🇹🇯 Tajikistan | Asia | 30 |
| 🇨🇾 Cyprus | Asia | 28 |
| 🇨🇬 Republic of the Congo | Africa | 27 |
| 🇬🇭 Ghana | Africa | 27 |
| 🇺🇦 Ukraine Rebels | Europe | 24 |
One relationship of significance is Russia’s provided weapons to Pro-Russia Ukrainian Rebels. Since 2014, Russia has offered arms and training to these rebels in their fight. These have included weapons of all sorts, from pistols and mines to tanks and missile launchers.
Effect of the War on Ukraine on Arms Trades
According to the latest data from SIPRI, the international arms trade fell by 4.6% in the last five-year period. Despite this, Europe has become a new hotspot for arms imports, seeing a 19% increase in arms transfers over the same time period.
Countries like the U.K., Netherlands, and Norway were the largest importers, and other countries might follow suit.
Experts claim that this upsurge is attributed to the crumbling relationship between Russia and Europe. Alarmed by Russia’s invasion of Ukraine, European countries have been reevaluating their defense budgets—as exemplified by Germany’s recent €100 billion commitment to boost its military strength.
In the coming years, the U.S. and Russia’s biggest arms transfer partners are likely to shift. But which way will arms transfers trend?

This article was published as a part of Visual Capitalist's Creator Program, which features data-driven visuals from some of our favorite Creators around the world.


War
Visualized: Top 15 Global Tank Fleets
Heavily armed and armored, the modern tank is a versatile and mobile weapons platform, and a critical piece of contemporary warfare.
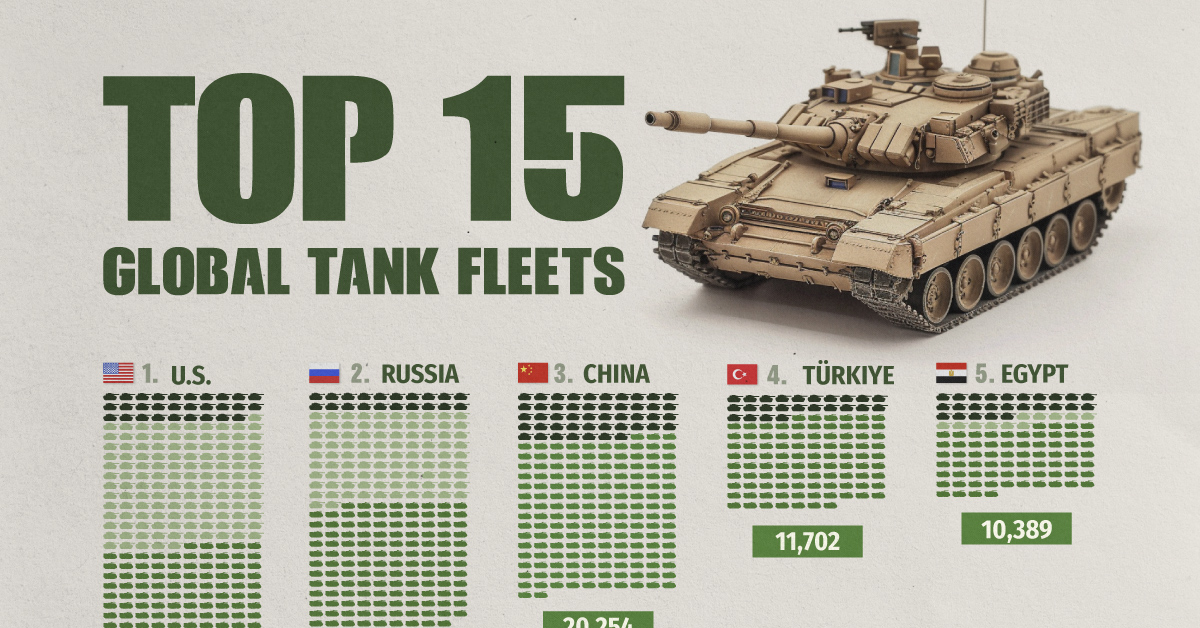
The Top 15 Global Tank Fleets
This was originally posted on our Voronoi app. Download the app for free on iOS or Android and discover incredible data-driven charts from a variety of trusted sources.
Heavily armed and armored, the modern tank is a versatile and mobile weapons platform, and a critical piece of contemporary warfare.
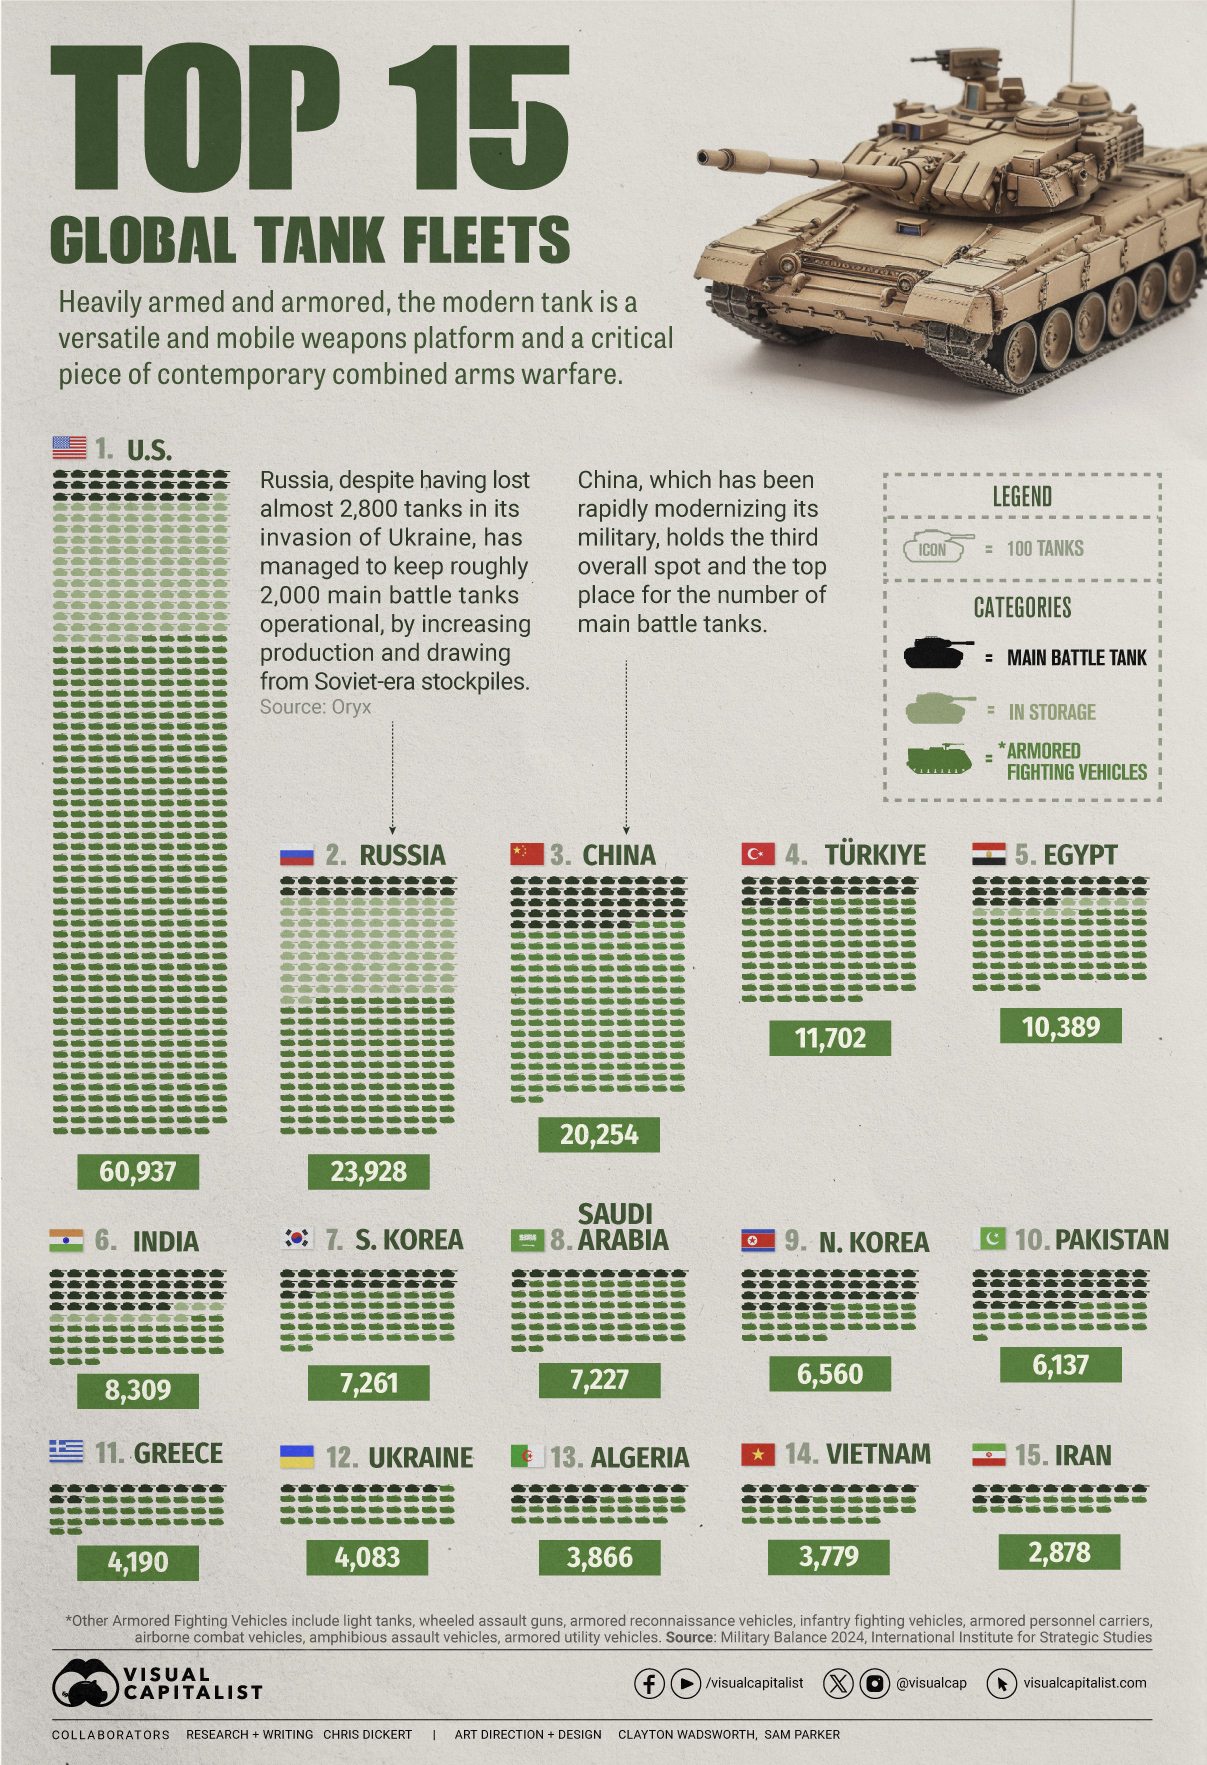
This visualization shows the top 15 global tank fleets, using data from the 2024 Military Balance report from the International Institute for Strategic Studies (IISS).
Let’s take an in-depth look at the top three fleets:
1. United States
As the world’s pre-eminent military power, it’s perhaps no surprise that the United States also has the largest tank fleet, by a wide margin.
In total, they have just over 45,000 armored fighting vehicles in operation, along with 2,640 main battle tanks (MBTs), and 12,800 vehicles in storage, of which 2,000 are main battle tanks.
| Category | Vehicles | Global rank |
|---|---|---|
| Main battle tanks | 2,640 | 4 |
| Armored reconnaissance | 1,745 | 1 |
| Infantry fighting vehicles | 3,262 | 3 |
| Armored personnel carriers | 10,644 | 1 |
| Amphibious assault vehicles | 1,401 | 1 |
| Armored utility vehicles | 28,445 | 1 |
| Storage | 12,800 | 1 |
| Total | 60,937 | 1 |
The U.S. is internalizing the lessons from the ongoing invasion of Ukraine, where Western-supplied anti-tank weapons and massed Ukrainian artillery have been cutting Russian tanks to pieces. As a result, the U.S. recently canceled an upgrade of the M1 Abrams in favor of a more ambitious upgrade.
Meanwhile, the U.S. is nervously eyeing a more confident China and a potential clash over Taiwan, where air and naval forces will be critical. However, a recent war game showed that Taiwanese mechanized ground forces, kitted out with American-made tanks and armored fighting vehicles, were critical in keeping the island autonomous.
2. Russia
According to Oryx, a Dutch open-source intelligence defense website, at time of writing, Russia has lost almost 2,800 main battle tanks since invading Ukraine. Considering that in the 2022 edition of the Military Balance, Russia was estimated to have 2,927 MBTs in operation, those are some hefty losses.
Russia has been able to maintain about 2,000 MBTs in the field, in part, by increasing domestic production. Many defense plants have been taken over by state-owned Rostec and now operate around the clock. Russia is also now spending a full third of their budget on defense, equivalent to about 7.5% of GDP.
At the same time, they’ve also been drawing down their Soviet-era stockpiles, which are modernized before being sent to the front. Just how long they can keep this up is an open question; their stockpiles are large, but not limitless. Here is what their storage levels look like:
| Category | 2023 | 2024 | YOY change |
|---|---|---|---|
| Main battle tanks | 5,000 | 4,000 | -20.0% |
| Armored reconnaissance | 1,000 | 100 | -90.0% |
| Infantry fighting vehicles | 4,000 | 2,800 | -30.0% |
| Armored personnel carriers | 6,000 | 2,300 | -61.7% |
| Total | 16,000 | 9,200 | -42.5% |
3. China
China holds the third overall spot and top place globally for the number of main battle tanks in operation. Untypically, the People’s Liberation Army has no armored vehicles in storage, which perhaps isn’t surprising when you consider that China has been rapidly modernizing its military and that stockpiles usually contain older models.
China also has one of the world’s largest fleets of armored fighting vehicles, second only to the United States. Breaking down that headline number, we can also see that they have the largest number of light tanks, wheeled guns, and infantry fighting vehicles.
| Category | Vehicles | Global rank |
|---|---|---|
| Main battle tanks | 4,700 | 1 |
| Light tanks | 1,330 | 1 |
| Wheeled guns | 1,250 | 1 |
| Infantry fighting vehicles | 8,200 | 1 |
| Armored personnel carriers | 3,604 | 5 |
| Airborne combat vehicles | 180 | 2 |
| Amphibious assault vehicles | 990 | 2 |
| Total | 20,254 | 3 |
This is equipment that would be integral if China were to make an attempt to reunify Taiwan with the mainland by force, where lightly armored mechanized units need to move with speed to occupy the island before Western allies can enter the fray. It’s worth noting that China also has one of the world’s largest fleets of amphibious assault vehicles.
End of the Tank?
Many commentators at the outset of Russia’s invasion of Ukraine, were quick to predict the end of the tank, however, to paraphrase Mark Twain, reports of the tank’s demise are greatly exaggerated.
With the U.S. and China both developing remote and autonomous armored vehicles, tanks could be quite different in the future, but there is nothing else that matches them for firepower, mobility, and survivability on the modern battlefield today.

-

 Debt1 week ago
How Debt-to-GDP Ratios Have Changed Since 2000
-

 Markets2 weeks ago
Ranked: The World’s Top Flight Routes, by Revenue
-

 Countries2 weeks ago
Population Projections: The World’s 6 Largest Countries in 2075
-

 Markets2 weeks ago
The Top 10 States by Real GDP Growth in 2023
-

 Demographics2 weeks ago
The Smallest Gender Wage Gaps in OECD Countries
-

 Economy2 weeks ago
Where U.S. Inflation Hit the Hardest in March 2024
-

 Green2 weeks ago
Top Countries By Forest Growth Since 2001
-

 United States2 weeks ago
Ranked: The Largest U.S. Corporations by Number of Employees