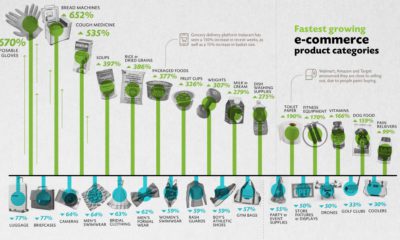

We visualize the ecommerce categories that have experienced the fastest growth, and the categories that are in decline during the COVID-19 pandemic.
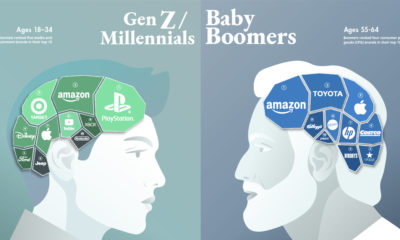

Can a brand transcend time and be all things to all people? This graphic seeks to find out by visualizing the most loved brands by generation.
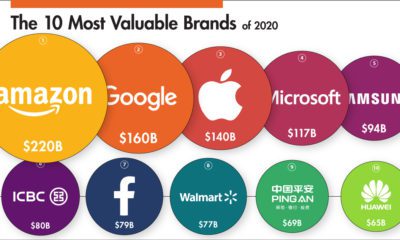

This infographic ranks some of the world’s biggest companies by brand value in 2020 and visualizes the movers and shakers over the past year.
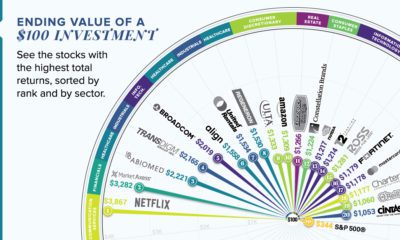

This graphic reveals the best-performing stocks over the last 10 years, and shows how much an initial $100 investment would be worth today.
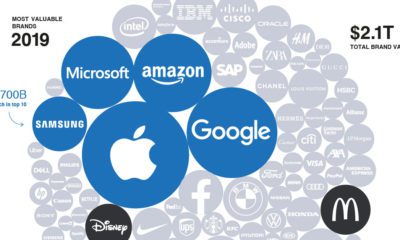

Changing consumer expectations have created a harsh environment for traditional brands to operate in—will tech companies make them obsolete?
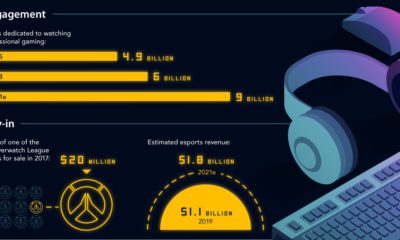

This infographic plots the journey of esports, from underground niche to a billion-dollar mainstream phenomenon—and it shows no signs of slowing down.
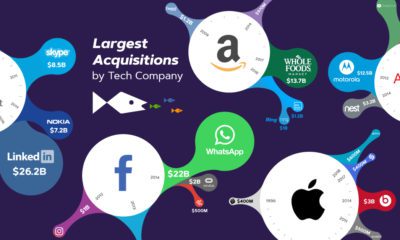

The ‘Big Five’ tech companies are rapidly reshaping the global tech landscape with their acquisitions, devouring any competitor who gets in their way.


eSports has evolved into a billion dollar industry in just a decade, but how does it fare against traditional sports when it comes to monetization?
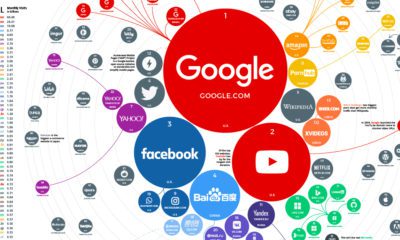

The top 100 websites ranking reveals how people around the world search for information, which services they use, and how they spend time online.
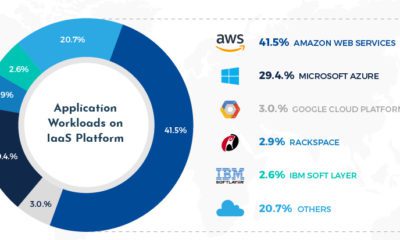

Do you watch Netflix or use Facebook? If so, then you are indirectly leveraging Amazon's incredible scale and dominance of the cloud.


