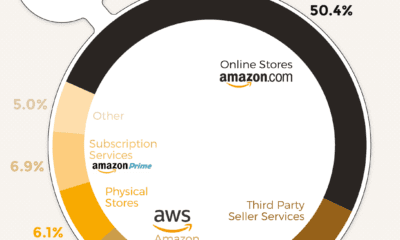

In 2019, Amazon generated $281 billion in total revenue—but where does all this revenue come from? Here’s a breakdown of how Amazon makes its money.
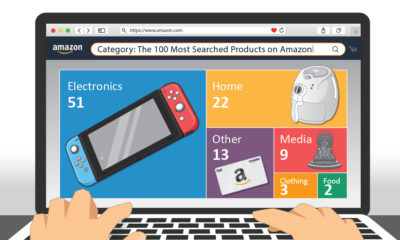

This graphic highlights the top product searches on Amazon in the U.S., providing a glimpse of what items American consumers are after.


A lot can happen in an internet minute. This graphic looks at the enormous numbers behind the online services billions use every day.
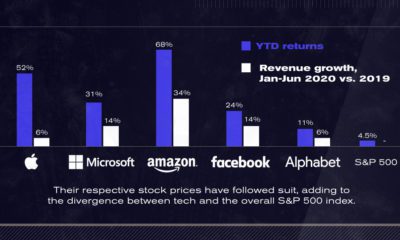

After a strong start to 2020, U.S. tech giants continue to advance to unprecedented highs. The Big Five now account for 25% of the S&P 500.
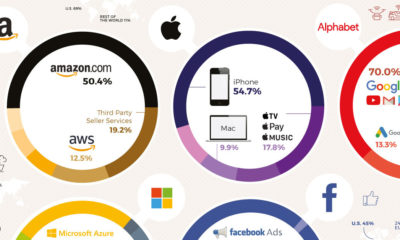

The big five tech companies generate almost $900 billion in revenues combined, more than the GDP of four of the G20 nations. Here's how they earn...
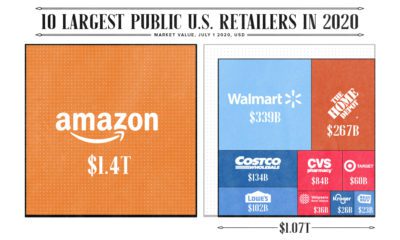

Amazon's valuation has grown by 2,830% over the last decade, and the tech giant is now worth more than the other 9 largest U.S. retailers, combined.
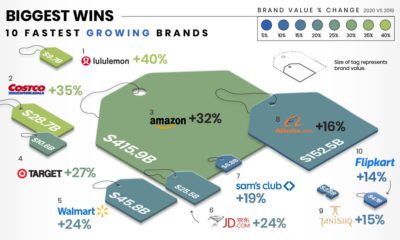

This infographic illustrates how the fastest growing and declining retail brands are attempting to stay relevant in the pandemic economy.
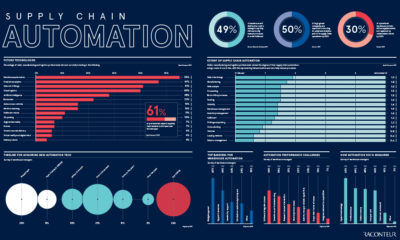

As COVID-19 disrupts global supply chains, we take a look at how industries are investing in automation—and what this is tells us about the future.
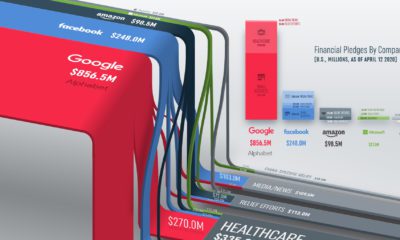

Breaking down the $1.25 billion in funding announced by Big Tech companies to fight the pandemic.
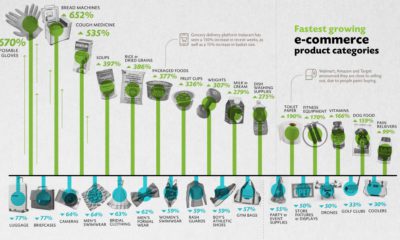

We visualize the ecommerce categories that have experienced the fastest growth, and the categories that are in decline during the COVID-19 pandemic.


