Technology
Ranking the Top 100 Websites in the World
Get this infographic as a poster (and save 15% by being a VC+ member)
View the full-resolution version of this visualization
As a greater portion of the world begins to live more of their life online, the world’s top 100 websites continue to see explosive growth in their traffic numbers.
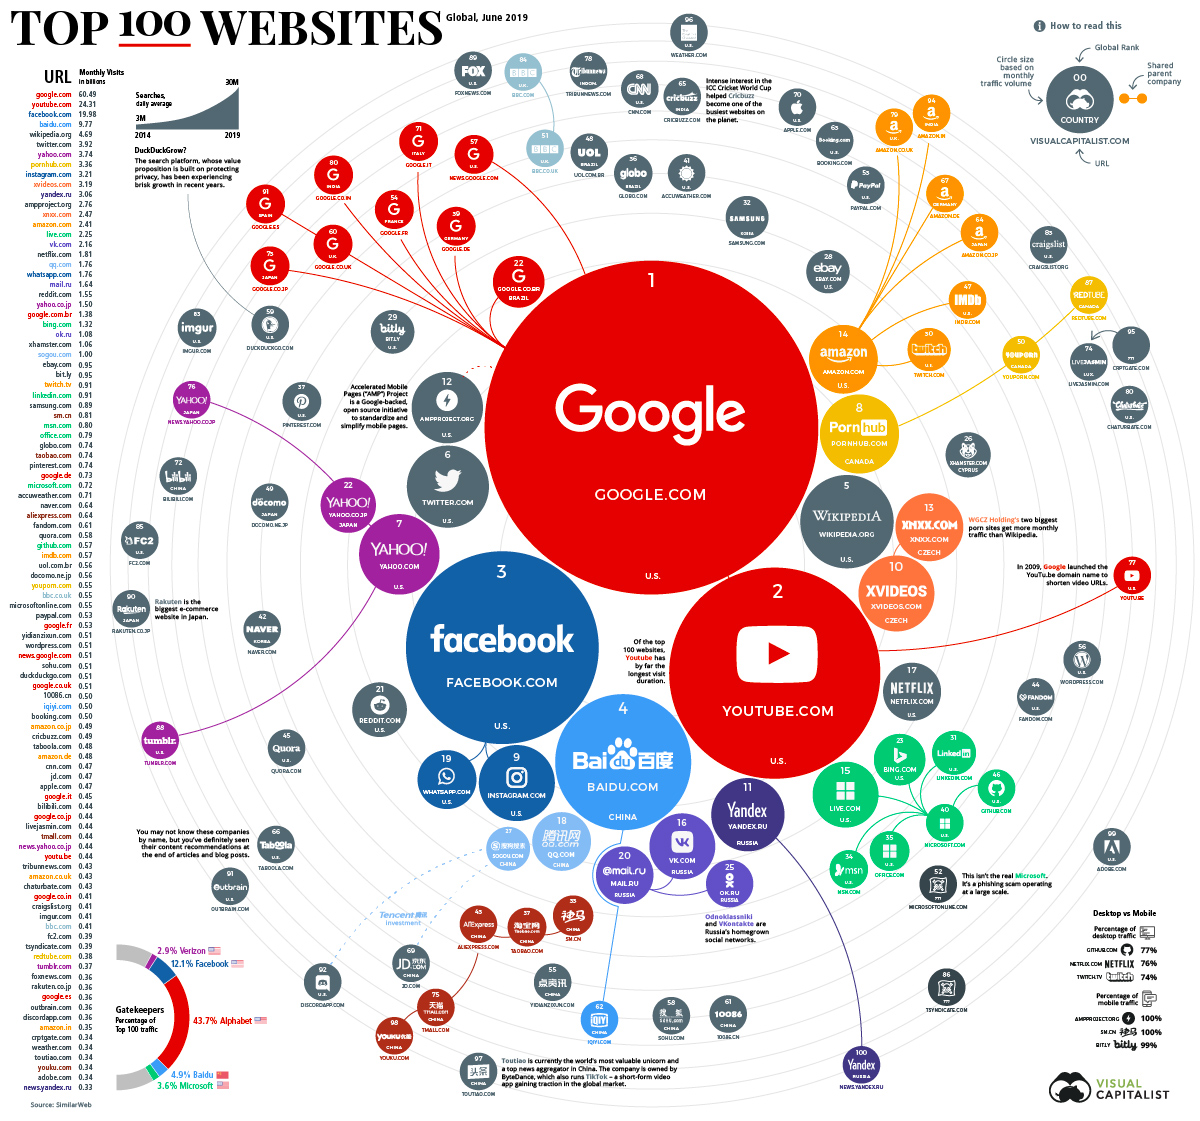
To claim even the 100th spot in this ranking, your website would need around 350 million visits in a single month. Using data from SimilarWeb, we’ve visually mapped out the top 100 biggest websites on the internet. Examining the ranking reveals a lot about how people around the world search for information, which services they use, and how they spend time online.
Note: This is a ranking of biggest websites, specifically. Brands that extend across platforms or serve the majority of their users through an app will not necessarily rank well on this list. As a result, you’ll notice the absence of companies like WeChat and Snapchat.
The Top 100 Websites
The 100 biggest websites generated a staggering 206 billion visits in June 2019. Google, YouTube, and Facebook took the top spots, followed by Baidu and Wikipedia. Below is the full ranking:
| Global Rank | Domain | Monthly visits (billions) | Parent | Country |
|---|---|---|---|---|
| 1 | Google.com | 60.49 | Alphabet Inc | 🇺🇸 United States |
| 2 | Youtube.com | 24.31 | Alphabet Inc | 🇺🇸 United States |
| 3 | Facebook.com | 19.98 | Facebook, Inc | 🇺🇸 United States |
| 4 | Baidu.com | 9.77 | Baidu, Inc | 🇨🇳 China |
| 5 | Wikipedia.org | 4.69 | Wikimedia Foundation | 🇺🇸 United States |
| 6 | Twitter.com | 3.92 | Twitter, Inc | 🇺🇸 United States |
| 7 | Yahoo.com | 3.74 | Verizon Comm. Inc | 🇺🇸 United States |
| 8 | pornhub.com | 3.36 | Mindgeek | 🇨🇦 Canada |
| 9 | Instagram.com | 3.21 | Facebook, Inc | 🇺🇸 United States |
| 10 | xvideos.com | 3.19 | WGCZ Holding | 🇨🇿 Czech Republic |
| 11 | yandex.ru | 3.06 | Yandex | 🇷🇺 Russia |
| 12 | ampproject.org | 2.76 | N/A | 🇺🇸 United States |
| 13 | xnxx.com | 2.47 | WGCZ Holding | 🇨🇿 Czech Republic |
| 14 | amazon.com | 2.41 | Amazon.com, Inc | 🇺🇸 United States |
| 15 | live.com | 2.25 | Microsoft Corporation | 🇺🇸 United States |
| 16 | vk.com | 2.16 | Mail.ru Group | 🇷🇺 Russia |
| 17 | netflix.com | 1.81 | Netflix, Inc | 🇺🇸 United States |
| 18 | qq.com | 1.76 | Tencent | 🇨🇳 China |
| 19 | whatsapp.com | 1.76 | Facebook, Inc | 🇺🇸 United States |
| 20 | mail.ru | 1.64 | Mail.ru Group | 🇷🇺 Russia |
| 21 | Reddit.com | 1.55 | Advance Publications | 🇺🇸 United States |
| 22 | yahoo.co.jp | 1.5 | Verizon Comm. Inc | 🇯🇵 Japan |
| 23 | google.com.br | 1.38 | Alphabet Inc | 🇧🇷 Brazil |
| 24 | bing.com | 1.32 | Microsoft Corporation | 🇺🇸 United States |
| 25 | ok.ru | 1.08 | Mail.ru Group | 🇷🇺 Russia |
| 26 | xhamster.com | 1.06 | Hammy Media Ltd | 🇨🇾 Cyprus |
| 27 | sogou.com | 1 | Tencent, Sohu Inc | 🇨🇳 China |
| 28 | ebay.com | 0.95 | eBay Inc | 🇺🇸 United States |
| 29 | bit.ly | 0.95 | Spectrum Equity | 🇺🇸 United States |
| 30 | twitch.tv | 0.91 | Amazon.com, Inc | 🇺🇸 United States |
| 31 | linkedin.com | 0.91 | Microsoft Corporation | 🇺🇸 United States |
| 32 | samsung.com | 0.89 | Samsung Group | 🇰🇷 South Korea |
| 33 | sm.cn | 0.81 | Alibaba Group | 🇨🇳 China |
| 34 | msn.com | 0.8 | Microsoft Corporation | 🇺🇸 United States |
| 35 | office.com | 0.79 | Microsoft Corporation | 🇺🇸 United States |
| 36 | globo.com | 0.74 | Grupo Globo | 🇧🇷 Brazil |
| 37 | taobao.com | 0.74 | Alibaba Group | 🇨🇳 China |
| 38 | pinterest.com | 0.74 | Pinterest, Inc | 🇺🇸 United States |
| 39 | google.de | 0.73 | Alphabet Inc | 🇩🇪 Germany |
| 40 | Microsoft.com | 0.72 | Microsoft Corporation | 🇺🇸 United States |
| 41 | accuweather.com | 0.71 | AccuWeather Inc | 🇺🇸 United States |
| 42 | naver.com | 0.64 | Naver Corporation | 🇰🇷 South Korea |
| 43 | aliexpress.com | 0.64 | Alibaba Group | 🇨🇳 China |
| 44 | fandom.com | 0.61 | Wikia Inc | 🇺🇸 United States |
| 45 | quora.com | 0.58 | Quora Inc | 🇺🇸 United States |
| 46 | github.com | 0.57 | Microsoft Corporation | 🇺🇸 United States |
| 47 | imdb.com | 0.57 | Amazon.com, Inc | 🇺🇸 United States |
| 48 | uol.com.br | 0.56 | Grupo Folha | 🇧🇷 Brazil |
| 49 | docomo.ne.jp | 0.56 | Tata Teleservices | 🇯🇵 Japan |
| 50 | youporn.com | 0.55 | Mindgeek | 🇨🇦 Canada |
| 51 | bbc.co.uk | 0.55 | Public owned | 🇬🇧 United Kingdom |
| 52 | microsoftonline.com | 0.55 | Unknown | 🏴 Unknown |
| 53 | paypal.com | 0.53 | Paypal | 🇺🇸 United States |
| 54 | google.fr | 0.53 | Alphabet Inc | 🇫🇷 France |
| 55 | yidianzixun.com | 0.51 | Particle Inc | 🇨🇳 China |
| 56 | wordpress.com | 0.51 | Automattic | 🇺🇸 United States |
| 57 | news.google.com | 0.51 | Alphabet Inc | 🇺🇸 United States |
| 58 | sohu.com | 0.51 | Sohu | 🇨🇳 China |
| 59 | duckduckgo.com | 0.51 | Duck Duck Go, Inc | 🇺🇸 United States |
| 60 | google.co.uk | 0.51 | Alphabet Inc | 🇬🇧 United Kingdom |
| 61 | 10086.cn | 0.5 | China Mobile | 🇨🇳 China |
| 62 | iqiyi.com | 0.5 | Baidu, Inc | 🇨🇳 China |
| 63 | booking.com | 0.5 | Booking Holdings | 🇺🇸 United States |
| 64 | amazon.co.jp | 0.49 | Amazon.com, Inc | 🇯🇵 Japan |
| 65 | cricbuzz.com | 0.49 | Times Internet | 🇮🇳 India |
| 66 | taboola.com | 0.48 | Taboola Inc | 🇺🇸 United States |
| 67 | amazon.de | 0.48 | Amazon.com, Inc | 🇩🇪 Germany |
| 68 | cnn.com | 0.47 | Turner Broadcasting | 🇺🇸 United States |
| 69 | jd.com | 0.47 | Various (Tencent 20%) | 🇨🇳 China |
| 70 | apple.com | 0.47 | Apple Inc | 🇺🇸 United States |
| 71 | google.it | 0.45 | Alphabet Inc | 🇮🇹 Italy |
| 72 | bilibili.com | 0.44 | Bilibili Inc | 🇨🇳 China |
| 73 | google.co.jp | 0.44 | Alphabet Inc | 🇯🇵 Japan |
| 74 | livejasmin.com | 0.44 | Docler Group | 🇱🇺 Luxembourg |
| 75 | tmall.com | 0.44 | Alibaba Group | 🇨🇳 China |
| 76 | news.yahoo.co.jp | 0.44 | Verizon Comm. Inc | 🇯🇵 Japan |
| 77 | youtu.be | 0.44 | Alphabet Inc | 🇺🇸 United States |
| 78 | tribunnews.com | 0.43 | Kompas Gramedia Group | 🇮🇩 Indonesia |
| 79 | amazon.co.uk | 0.43 | Amazon.com, Inc | 🇬🇧 United Kingdom |
| 80 | chaturbate.com | 0.43 | Multi Media LLC | 🇺🇸 United States |
| 81 | google.co.in | 0.41 | Alphabet Inc | 🇮🇳 India |
| 82 | craigslist.org | 0.41 | Craigslist | 🇺🇸 United States |
| 83 | imgur.com | 0.41 | Imgur Inc | 🇺🇸 United States |
| 84 | bbc.com | 0.41 | Public owned | 🇬🇧 United Kingdom |
| 85 | fc2.com | 0.39 | FC2, Inc | 🇺🇸 United States |
| 86 | tsyndicate.com | 0.39 | Unknown | 🏴 Unknown |
| 87 | redtube.com | 0.38 | Mindgeek | 🇨🇦 Canada |
| 88 | tumblr.com | 0.37 | Verizon | 🇺🇸 United States |
| 89 | foxnews.com | 0.36 | Fox Corporation | 🇺🇸 United States |
| 90 | rakuten.co.jp | 0.36 | Rakuten Inc | 🇯🇵 Japan |
| 91 | google.es | 0.36 | Alphabet Inc | 🇪🇸 Spain |
| 92 | outbrain.com | 0.36 | Outbrain Inc | 🇺🇸 United States |
| 93 | discordapp.com | 0.36 | Various | 🇺🇸 United States |
| 94 | amazon.in | 0.35 | Amazon.com, Inc | 🇮🇳 India |
| 95 | crptgate.com | 0.34 | Unknown | 🏴 Unknown |
| 96 | weather.com | 0.34 | Landmark Media Enterprises, LLC | 🇺🇸 United States |
| 97 | toutiao.com | 0.34 | Bytedance | 🇨🇳 China |
| 98 | youku.com | 0.34 | Alibaba Group | 🇨🇳 China |
| 99 | adobe.com | 0.34 | Adobe Inc | 🇺🇸 United States |
| 100 | news.yandex.ru | 0.33 | Yandex | 🇷🇺 Russia |
Search Reigns Supreme
Search engines provide the connective tissue that binds the internet together, and they accounted for the majority of website traffic in the top 100 ranking.
Google is the undisputed top website in nearly every country in the world. In fact, Alphabet’s 11 domains in the top 100 ranking – including YouTube and a number of international versions of Google – racked up an impressive 90 billion visits in a single month.
Exceptions to Google’s dominance can be found in China (Baidu) and Russia (Yandex), where homegrown search engines have managed to capture the domestic market.
One scrappy competitor, DuckDuckGo, is slowly gaining prominence as an alternative to Google. The search engine’s focus on user privacy appears to be resonating with internet users as the site’s traffic has surpassed 500 million visits per month.
Full Stream Ahead
Video streaming and sharing is another major driver of global internet traffic.
Thanks to high-powered phones and bigger data plans, video is now a prominent portion of internet content consumption. This can take a few forms, from binge watching TV shows on Netflix to short-form video uploads on platforms like Douyin and Instagram.
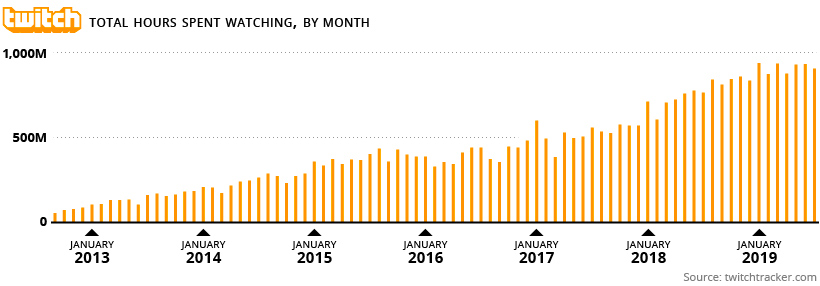
Live streaming is increasingly a bigger part of the mix. Twitch, which is focused on gaming, is now ranked 30th in the world in web traffic. The Amazon-owned platform is now so popular that on any given night, its viewership surpasses many of the major U.S. cable networks.

Of course, this category also includes adult content, which is well represented in this ranking. XNXX, XVideos, and PornHub all made the top 20, and the three websites combined for over nine billion visits in the most recent month of data available.
Old Dogs, New Tricks
Classic web portals such as MSN and Yahoo are still putting up impressive traffic numbers, but major players are increasingly staying relevant by acquiring rising internet stars.
In the case of Microsoft, acquiring Github and Linkedin helped the company target new markets and grow their overall presence online. Amazon’s acquisition of Twitch proved to be a good bet, and Instagram continues to breathe new life into Facebook, which has seen a backlash focused on its original namesake social network.
Google isn’t sitting still either. The company recently championed the open-source AMP Project to help improve the performance of mobile pages, which are increasingly bogged down by adware, unoptimized images, and JavaScript. In a short amount of time, the AMP Project has taken off to become one of the biggest websites in the world.
The project is not without controversy though.
Critics point out that cached AMP pages – which are hosted by Google – essentially cut out content creators, and that non-compliant pages may lose their ranking on mobile search results. As the project moves towards becoming a foundation, it remains to be seen how AMP will evolve and how much involvement Google will have in the future.
The Geography of the Top 100 Websites
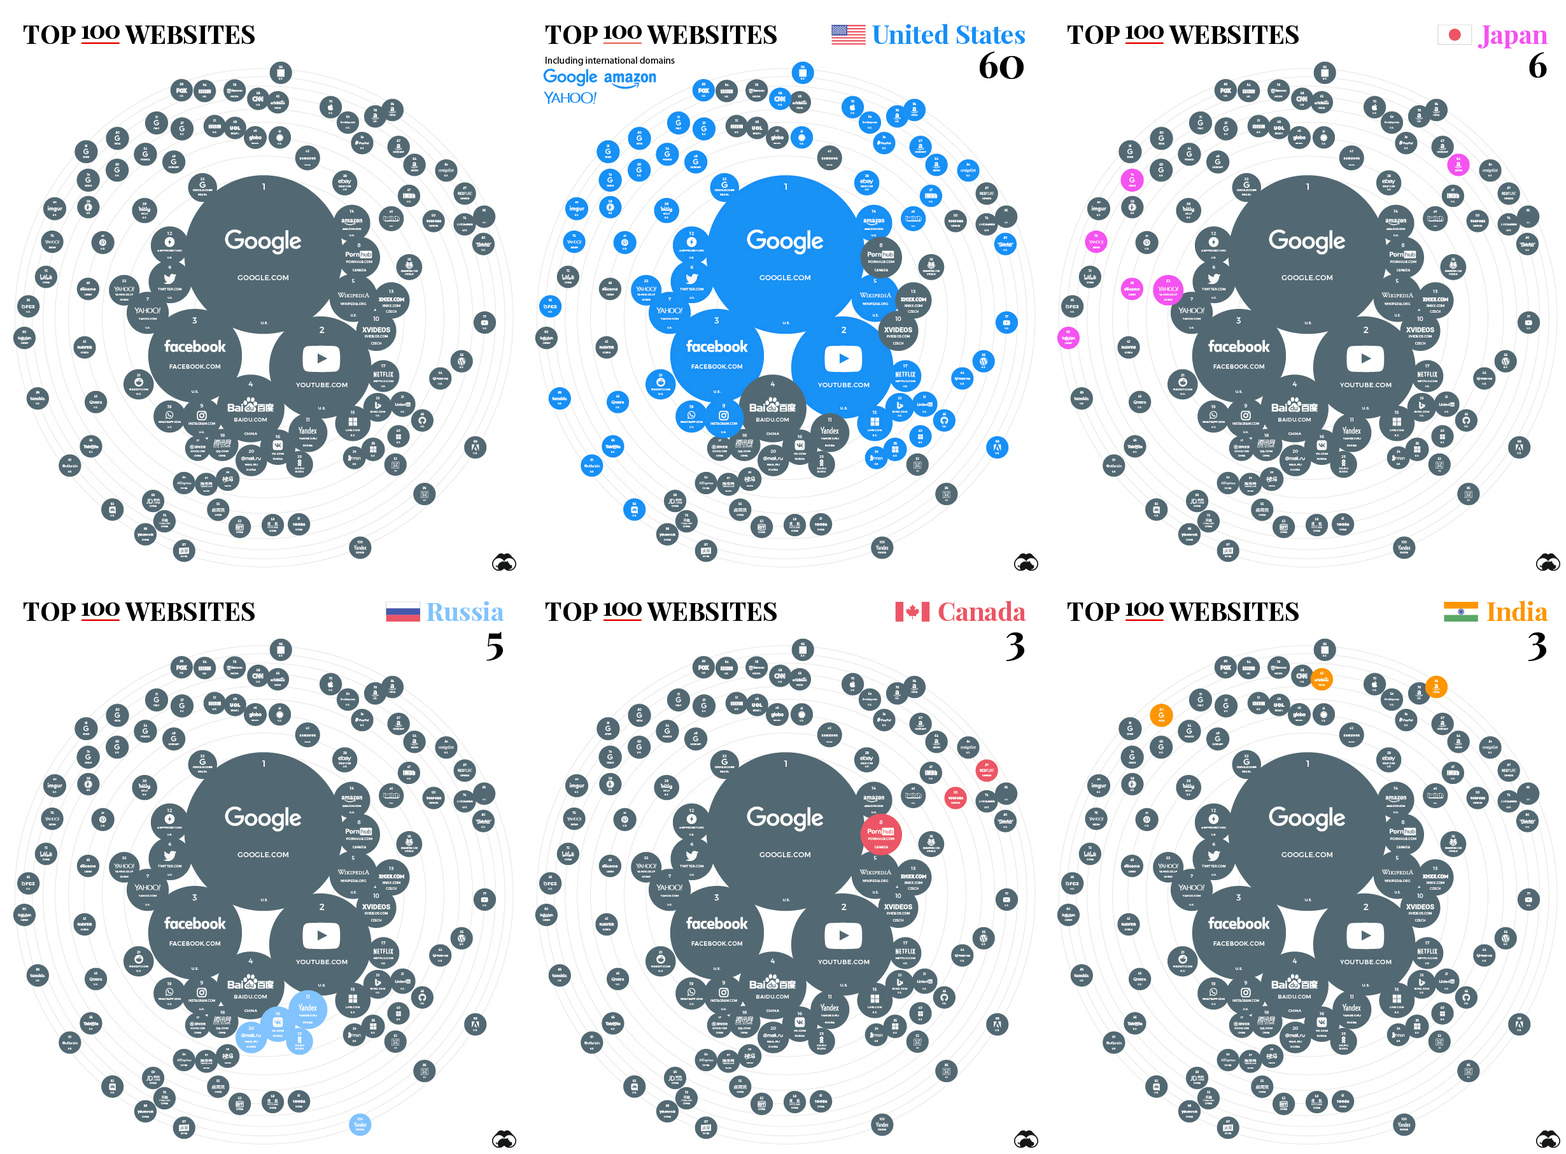
The internet may be a global network, but many of the gatekeepers are still located in the United States. If international domain suffixes of companies like Amazon and Google are counted, 60 of the 100 websites in the ranking are American.
Below is a breakdown of the Top 100 by country.

China is a strong runner-up, with 15 websites in the Top 100. While most of these Chinese companies are focused on the sizable domestic market, some are also making global inroads through investment. Tencent has partially backed the fast-growing chat platform, Discord, and it also has double-digit stakes in Snapchat and Spotify.
With the exception of Baidu, all of the biggest websites in the world have swelled in size by serving a global audience. As the tech market continues to mature in China, it remains to be seen whether Chinese companies can successfully move beyond the firewall to become the next Facebook or Google.
Correction: Bilibili, a website run by a Chinese company, was incorrectly identified as a Japanese company.
Technology
All of the Grants Given by the U.S. CHIPS Act
Intel, TSMC, and more have received billions in subsidies from the U.S. CHIPS Act in 2024.

All of the Grants Given by the U.S. CHIPS Act
This was originally posted on our Voronoi app. Download the app for free on iOS or Android and discover incredible data-driven charts from a variety of trusted sources.
This visualization shows which companies are receiving grants from the U.S. CHIPS Act, as of April 25, 2024. The CHIPS Act is a federal statute signed into law by President Joe Biden that authorizes $280 billion in new funding to boost domestic research and manufacturing of semiconductors.
The grant amounts visualized in this graphic are intended to accelerate the production of semiconductor fabrication plants (fabs) across the United States.
Data and Company Highlights
The figures we used to create this graphic were collected from a variety of public news sources. The Semiconductor Industry Association (SIA) also maintains a tracker for CHIPS Act recipients, though at the time of writing it does not have the latest details for Micron.
| Company | Federal Grant Amount | Anticipated Investment From Company |
|---|---|---|
| 🇺🇸 Intel | $8,500,000,000 | $100,000,000,000 |
| 🇹🇼 TSMC | $6,600,000,000 | $65,000,000,000 |
| 🇰🇷 Samsung | $6,400,000,000 | $45,000,000,000 |
| 🇺🇸 Micron | $6,100,000,000 | $50,000,000,000 |
| 🇺🇸 GlobalFoundries | $1,500,000,000 | $12,000,000,000 |
| 🇺🇸 Microchip | $162,000,000 | N/A |
| 🇬🇧 BAE Systems | $35,000,000 | N/A |
BAE Systems was not included in the graphic due to size limitations
Intel’s Massive Plans
Intel is receiving the largest share of the pie, with $8.5 billion in grants (plus an additional $11 billion in government loans). This grant accounts for 22% of the CHIPS Act’s total subsidies for chip production.
From Intel’s side, the company is expected to invest $100 billion to construct new fabs in Arizona and Ohio, while modernizing and/or expanding existing fabs in Oregon and New Mexico. Intel could also claim another $25 billion in credits through the U.S. Treasury Department’s Investment Tax Credit.
TSMC Expands its U.S. Presence
TSMC, the world’s largest semiconductor foundry company, is receiving a hefty $6.6 billion to construct a new chip plant with three fabs in Arizona. The Taiwanese chipmaker is expected to invest $65 billion into the project.
The plant’s first fab will be up and running in the first half of 2025, leveraging 4 nm (nanometer) technology. According to TrendForce, the other fabs will produce chips on more advanced 3 nm and 2 nm processes.
The Latest Grant Goes to Micron
Micron, the only U.S.-based manufacturer of memory chips, is set to receive $6.1 billion in grants to support its plans of investing $50 billion through 2030. This investment will be used to construct new fabs in Idaho and New York.
-

 Education1 week ago
How Hard Is It to Get Into an Ivy League School?
-

 Technology2 weeks ago
Ranked: Semiconductor Companies by Industry Revenue Share
-

 Markets2 weeks ago
Ranked: The World’s Top Flight Routes, by Revenue
-

 Demographics2 weeks ago
Population Projections: The World’s 6 Largest Countries in 2075
-

 Markets2 weeks ago
The Top 10 States by Real GDP Growth in 2023
-

 Demographics2 weeks ago
The Smallest Gender Wage Gaps in OECD Countries
-

 Economy2 weeks ago
Where U.S. Inflation Hit the Hardest in March 2024
-

 Environment2 weeks ago
Top Countries By Forest Growth Since 2001


