Technology
Visualizing the Evolution of Consumer Credit
The origin of credit dates all the way back to ancient civilizations.
The Sumerians and later the Babylonians both used consumer loans in their societies, primarily for agricultural purposes. The latter civilization even had rules about maximum lending rates engraved in the famous Code of Hammurabi.
But since then, consumer credit — and how we calculate creditworthiness — has gotten increasingly sophisticated. This is so much the case that technology now used in modern credit scoring would seem completely alien to people living just a few decades ago.
Video: Consumer Credit Through the Ages
Today’s motion graphic video is powered by Equifax, and it shows the evolution of consumer credit over the last 5,000 years.
The video highlights how consumer credit has worked both in the past and in the present. It also dives into the technologies that will be shaping the future of credit, including artificial intelligence and the blockchain.
A Brief History of Credit
We previously visualized the 5,000-year history of consumer credit, and how it dramatically changed over many centuries and societies.
What may have started as agricultural loans in Sumer and Babylon eventually became more ingrained in Ancient Roman society. In the year 50 B.C., for example, Cicero documented a transaction that occurred, and wrote “nomina facit, negotium conficit” — or, “he uses credit to complete the purchase”.
Modern consumer credit itself was born in England in 1803, when a group of English tailors came together to swap information on customers that failed to settle their debts. Eventually, extensive credit lists of customers started being compiled, with lending really booming in the 20th century as consumers started buying big ticket items like cars and appliances.
Later, the innovation of credit cards came about, and in the 1980s, modern credit scoring was introduced.
The Present and Future of Credit
Learn about the modern credit landscape, as well as how technology is changing the future of consumer credit.
The modern numeric credit score came about in 1989, and it uses logistic regression to assess five categories related to a consumer’s creditworthiness: payment history, debt burden, length of credit history, types of credit used, and new credit requests.
However, in the current era of big data and emerging technologies, companies are now finding new ways to advance credit models — and how these change will affect how consumers get credit in the future.
Modern Tech
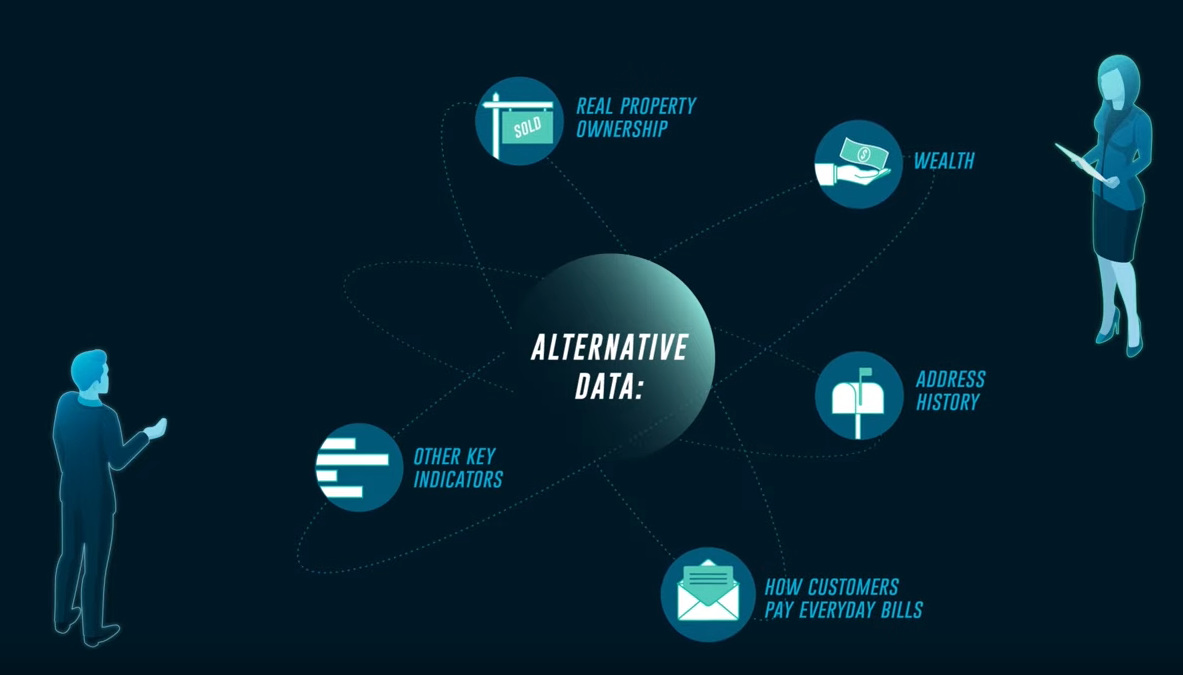
Consumer credit is already changing thanks to new methods such as trended data and alternative data. These both look at the bigger picture beyond traditional scoring, pulling in new data sources and using predictive methods to more accurately encapsulate creditworthiness.
Future Tech
In general, the future of credit will be shaped by five forces:
- Growing amounts of data
- A changing regulatory landscape
- Game-changing technologies
- Focus on identity
- The fintech boom
Through these forces, new credit models will integrate artificial intelligence, neural networks, big data, and more complex statistical methods. In short, credit patterns can be more accurately predicted using mountains of data and new technologies.
Finally, the credit landscape is set to shift in other ways, as well.
Regulatory forces are pushing data to be standardized and controlled directly by consumers, enabling a range of new fintech applications to benefit consumers. Meanwhile, the industry itself will be focusing in on identity to build trust and limit fraud, using technologies such as biometrics and blockchain to prove a borrower’s identity.


Technology
All of the Grants Given by the U.S. CHIPS Act
Intel, TSMC, and more have received billions in subsidies from the U.S. CHIPS Act in 2024.


All of the Grants Given by the U.S. CHIPS Act
This was originally posted on our Voronoi app. Download the app for free on iOS or Android and discover incredible data-driven charts from a variety of trusted sources.
This visualization shows which companies are receiving grants from the U.S. CHIPS Act, as of April 25, 2024. The CHIPS Act is a federal statute signed into law by President Joe Biden that authorizes $280 billion in new funding to boost domestic research and manufacturing of semiconductors.
The grant amounts visualized in this graphic are intended to accelerate the production of semiconductor fabrication plants (fabs) across the United States.
Data and Company Highlights
The figures we used to create this graphic were collected from a variety of public news sources. The Semiconductor Industry Association (SIA) also maintains a tracker for CHIPS Act recipients, though at the time of writing it does not have the latest details for Micron.
| Company | Federal Grant Amount | Anticipated Investment From Company |
|---|---|---|
| 🇺🇸 Intel | $8,500,000,000 | $100,000,000,000 |
| 🇹🇼 TSMC | $6,600,000,000 | $65,000,000,000 |
| 🇰🇷 Samsung | $6,400,000,000 | $45,000,000,000 |
| 🇺🇸 Micron | $6,100,000,000 | $50,000,000,000 |
| 🇺🇸 GlobalFoundries | $1,500,000,000 | $12,000,000,000 |
| 🇺🇸 Microchip | $162,000,000 | N/A |
| 🇬🇧 BAE Systems | $35,000,000 | N/A |
BAE Systems was not included in the graphic due to size limitations
Intel’s Massive Plans
Intel is receiving the largest share of the pie, with $8.5 billion in grants (plus an additional $11 billion in government loans). This grant accounts for 22% of the CHIPS Act’s total subsidies for chip production.
From Intel’s side, the company is expected to invest $100 billion to construct new fabs in Arizona and Ohio, while modernizing and/or expanding existing fabs in Oregon and New Mexico. Intel could also claim another $25 billion in credits through the U.S. Treasury Department’s Investment Tax Credit.
TSMC Expands its U.S. Presence
TSMC, the world’s largest semiconductor foundry company, is receiving a hefty $6.6 billion to construct a new chip plant with three fabs in Arizona. The Taiwanese chipmaker is expected to invest $65 billion into the project.
The plant’s first fab will be up and running in the first half of 2025, leveraging 4 nm (nanometer) technology. According to TrendForce, the other fabs will produce chips on more advanced 3 nm and 2 nm processes.
The Latest Grant Goes to Micron
Micron, the only U.S.-based manufacturer of memory chips, is set to receive $6.1 billion in grants to support its plans of investing $50 billion through 2030. This investment will be used to construct new fabs in Idaho and New York.

-

 Debt1 week ago
How Debt-to-GDP Ratios Have Changed Since 2000
-

 Markets2 weeks ago
Ranked: The World’s Top Flight Routes, by Revenue
-

 Countries2 weeks ago
Population Projections: The World’s 6 Largest Countries in 2075
-

 Markets2 weeks ago
The Top 10 States by Real GDP Growth in 2023
-

 Demographics2 weeks ago
The Smallest Gender Wage Gaps in OECD Countries
-

 United States2 weeks ago
Where U.S. Inflation Hit the Hardest in March 2024
-

 Green2 weeks ago
Top Countries By Forest Growth Since 2001
-

 United States2 weeks ago
Ranked: The Largest U.S. Corporations by Number of Employees