Bitcoin
Chart: How Bitcoin Reached Parity With Gold
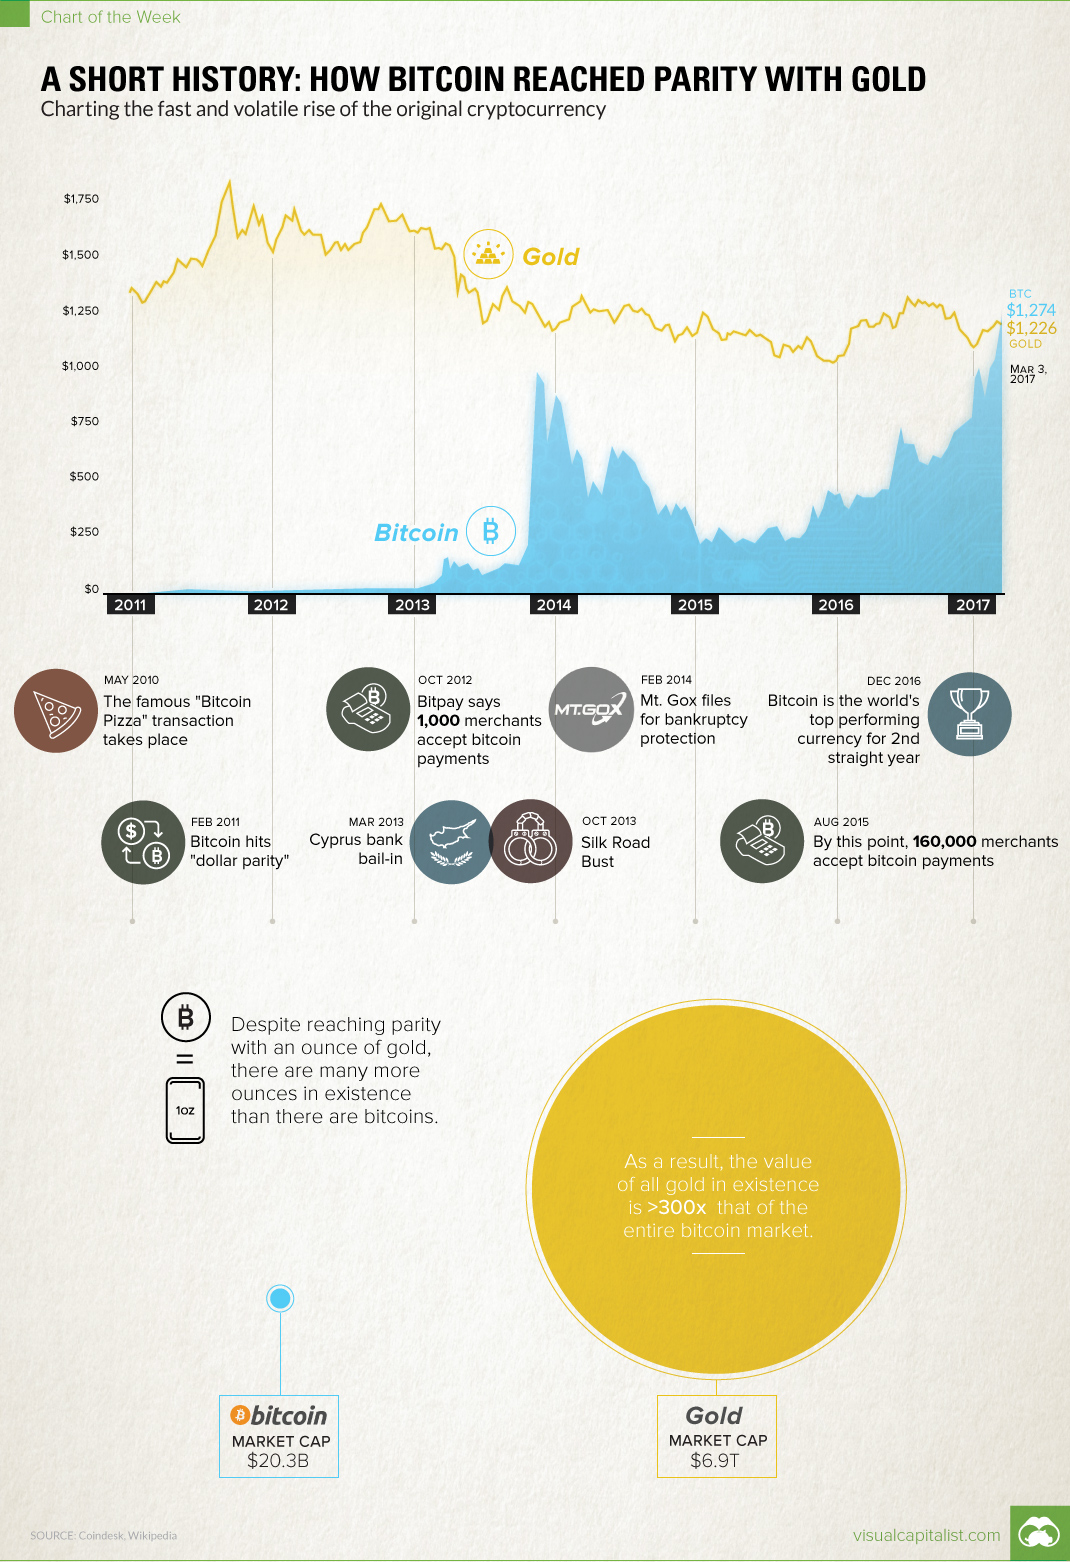
Chart: How Bitcoin Reached Parity With Gold
Charting the fast and volatile rise of bitcoin
The Chart of the Week is a weekly Visual Capitalist feature on Fridays.
Would you rather have one bitcoin, or a single ounce of gold?
The answer used to be obvious. Even at the climax of the legendary 2013 rally, bitcoin was never able to reach unit-for-unit parity with gold.
However, since an off-year in 2014, the enigmatic cryptocurrency has steadily climbed in price to take the title of the best-performing currency in both 2015 and 2016. And today? After continuing its rally into 2017, the price of bitcoin has now passed this arbitrary, but psychologically important measure of parity with an ounce of gold.
How did we get here so fast?
Bitcoin: A Short History
Here are some of the most important events that have shaped the bitcoin market:
May 2010: The famous “Bitcoin Pizza” transaction takes place.
This is one of the first “real world” transactions, in which one man indirectly paid 10,000 BTC for two Papa John’s pizzas. That works out to a pretty steep price of over $6 million per pizza using today’s prices, but we are sure they were delicious. Today, May 22 is still celebrated as “Bitcoin Pizza Day” throughout the Bitcoin community.
February 2011: Bitcoin hits “dollar parity”.
October 2012: Bitpay says 1,000 merchants accept bitcoin payments.
Early adopters of the cryptocurrency included WordPress.com, Reddit, OKCupid, and The Pirate Bay.
Mar 2013: Cyprus bank bail-in.
Generally speaking, the European Debt Crisis was a major boon for bitcoin. However, this specific event really put the potential downsides of the banking system and centralized fiat currencies in the limelight.
Oct 2013: Silk Road Bust
As prices were soaring at the end of 2013, the FBI seized 26,000 BTC from Silk Road and its alleged owner, Ross Ulbricht.
Feb 2014: Mt. Gox files for bankruptcy protection
The world’s biggest exchange, which at one point controlled 70% of bitcoin transactions, was plagued with hacks and other problems. It finally went under in 2014.
Aug 2015: By this point, 160,000 merchants accept bitcoin payments
Dec 2016: Bitcoin is the world’s top performing currency for 2nd straight year
See our charts on this for 2015 and 2016.
Bitcoin’s Rise in Context
For enthusiasts and speculators that have followed the cryptocurrency since the beginning, the meteoric rise of bitcoin has been a wild ride.
However, despite the feat of reaching unit-for-unit parity with gold, it is important to take in some context.
Firstly, there are about 16.2 million BTC in circulation – and there are 5.6 billion oz of gold that have been mined throughout history. For that reason the value of the gold market is still more than 300x higher.
Next, while the value of the bitcoin market has soared exponentially since the early days, it is still only worth about $20 billion in total – this is about half of the value of the average company on the S&P 500 (~$40 billion). Compare the bitcoin market to an Apple or Google, and it seems even less extraordinary.
But for those people that follow the crypto markets closely, this above context actually represents the potential upside of the digital cryptocurrency. It means bitcoin still has lots of room to soar – and since bitcoin supply is limited and cannot be created out of thin air, there is nowhere for the price to go but up.


Bitcoin
The 4th Bitcoin Halving Explained
We take a deep dive on historical Bitcoin data from Coinmetrics to see what lessons the 3 previous halvings might have for the future.
The 4th Bitcoin Halving Explained
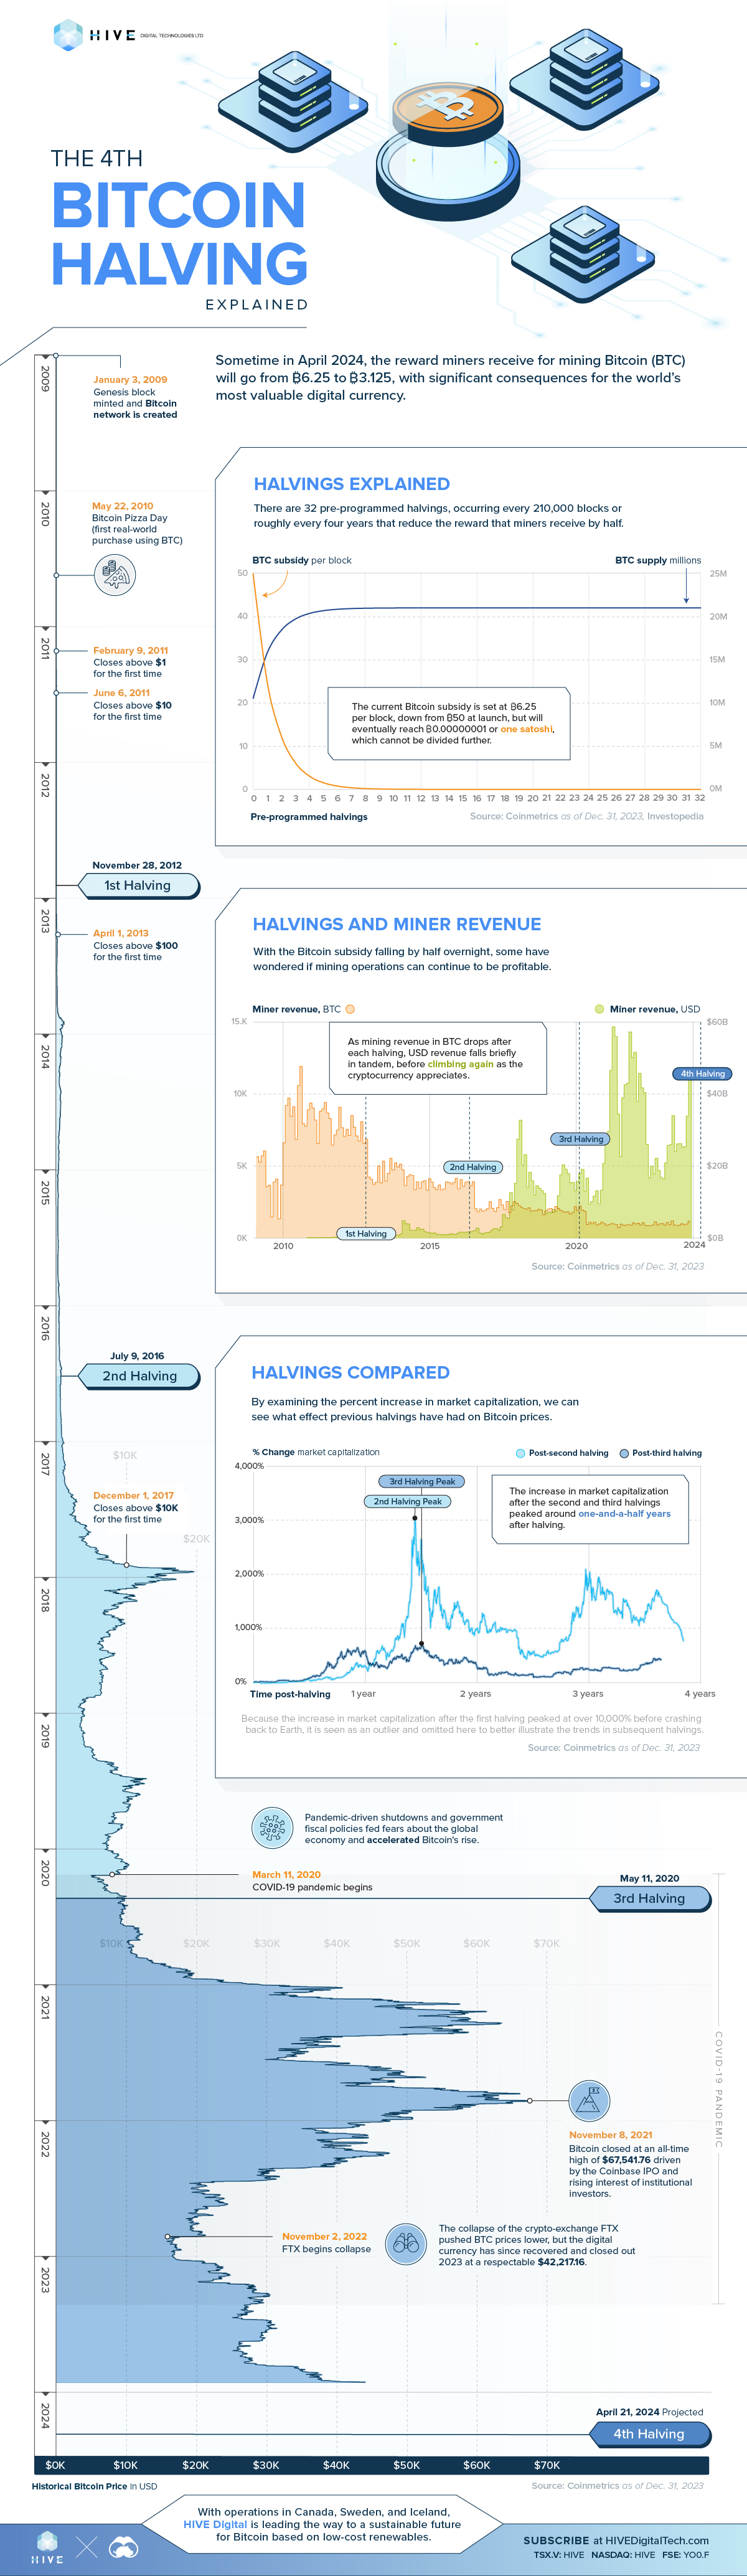
Sometime in April 2024, the reward that cryptocurrency miners receive for mining bitcoin (BTC) will go from ₿6.25 to ₿3.125, with significant consequences for the world’s most valuable digital currency.
To help understand this quadrennial event, we’ve teamed up with HIVE Digital to take a deep dive on historical bitcoin data from Coinmetrics to see what the three previous halvings might tell us about the fourth.
Bitcoin Explained
But to understand halvings, we first need to take a step back to talk a bit about how the Bitcoin network works.
Unlike fiat currencies like the U.S. dollar or the Chinese yuan that are backed by central banks, cryptocurrencies are supported by an underlying blockchain, which contains a record of every single bitcoin transaction in a public decentralized, distributed ledger.
When you spend a bitcoin, a digital record of that transaction needs to be validated and added to the blockchain. And this is where miners come in. They legitimize and audit bitcoin transactions, and as a reward, receive bitcoin in payment.
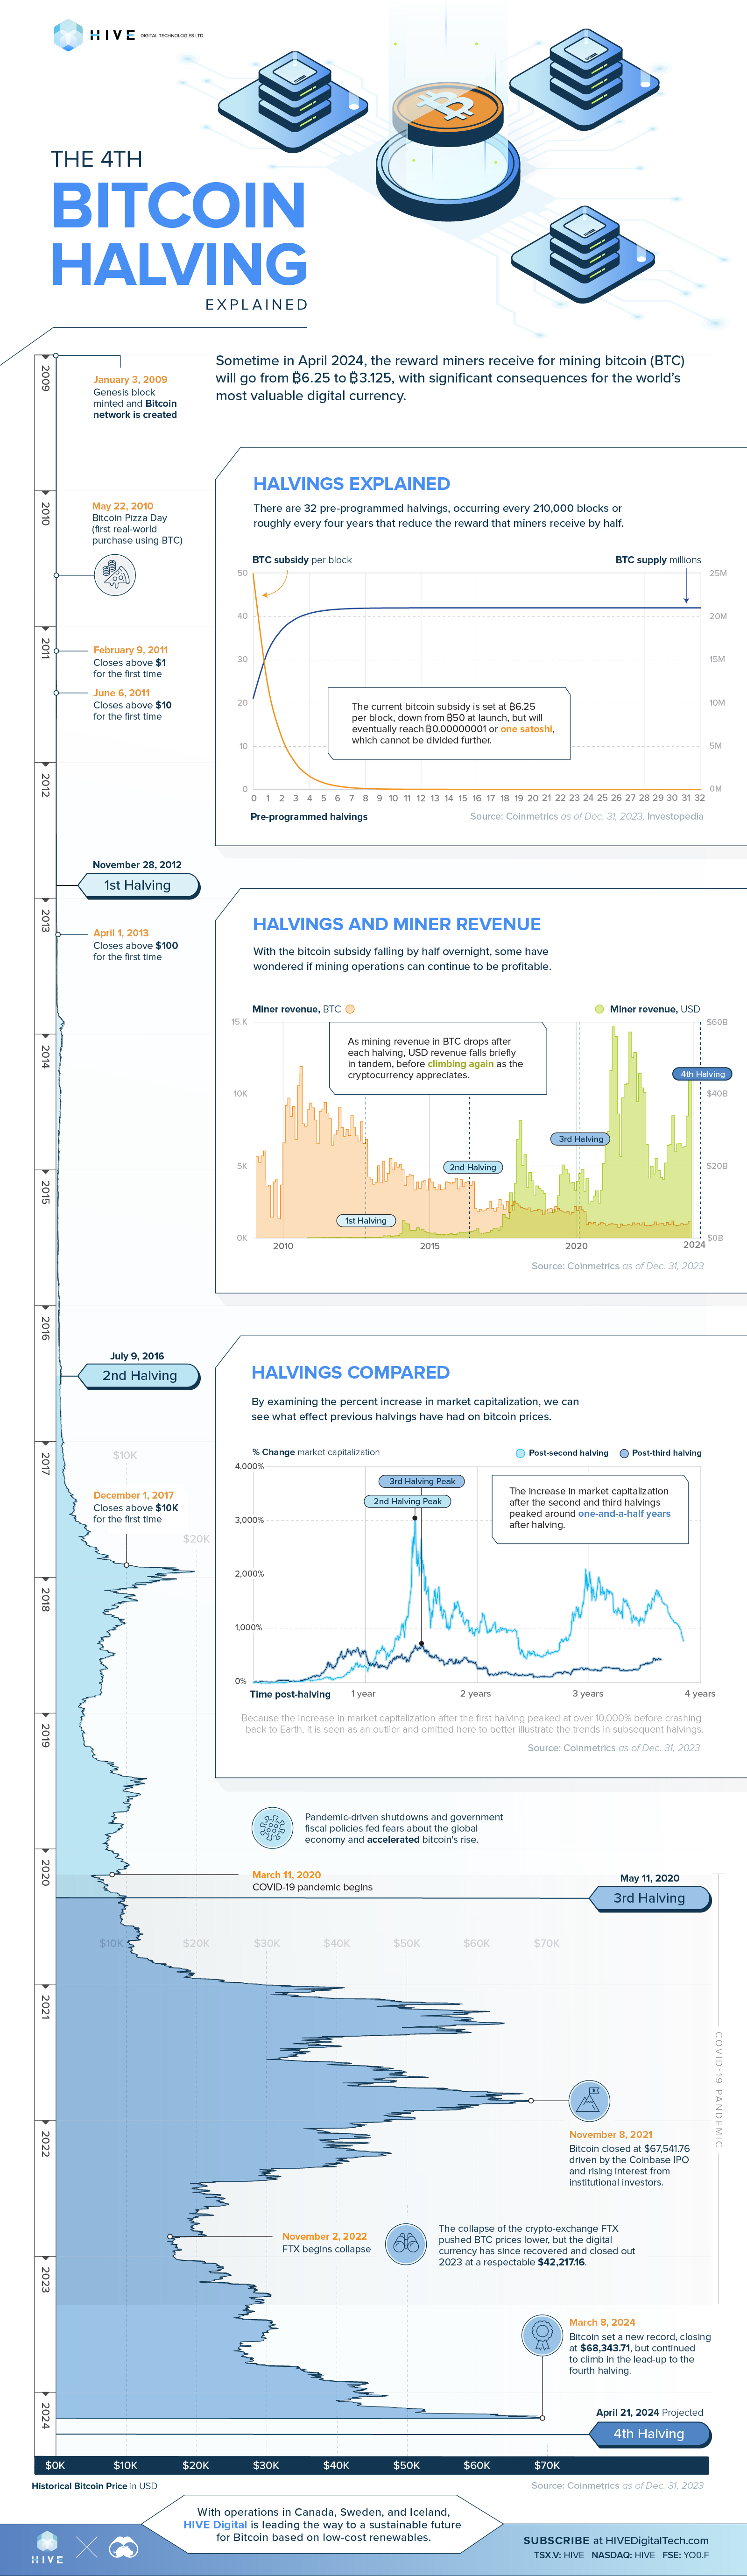
Halvings Explained
Now, quantitative easing notwithstanding, you normally can’t keep printing money forever without running into hyperinflation (think 1920s Germany or 1990s Argentina).
To get around this problem, the Bitcoin network has a pre-programmed upper limit of 21 million, with the reward that miners receive decreasing by half (hence, halving) roughly every four years.
When the Bitcoin network first launched, the reward was initially set to ₿50, an amount that was high enough to quickly increase the money supply and incentivize miners to participate in the validation process. On November 28, 2012, that reward decreased by half to ₿25, then to ₿12.5 on July 9, 2016, and on May 11, 2020, to ₿6.25.
The last halving will happen sometime in 2136, with the reward decreasing to ₿0.00000001 or one satoshi, the smallest denomination of bitcoin possible. The last bitcoin will enter circulation four years later, in 2140.
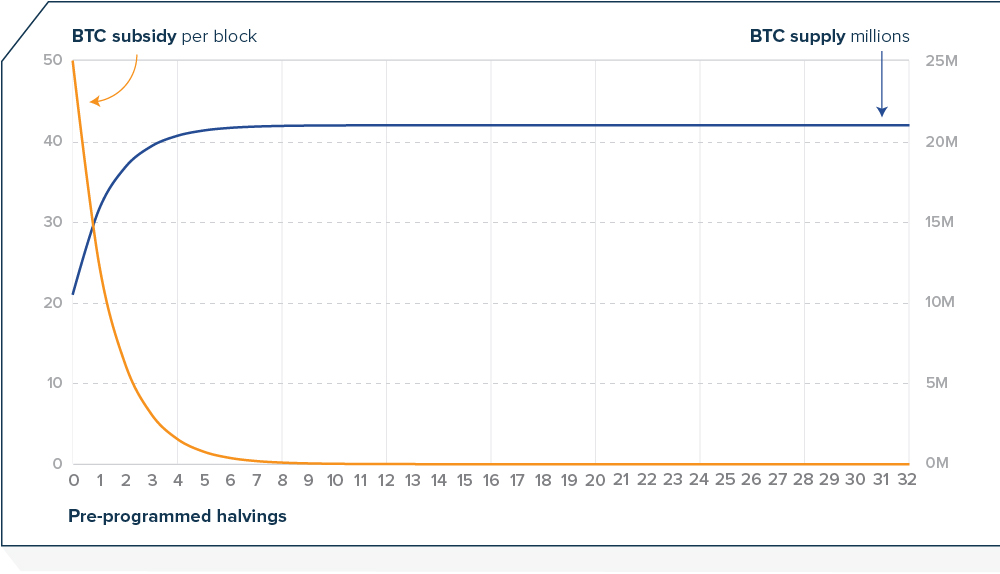
Halvings and Miner Revenue
With the fourth halving just around the corner, some have wondered whether mining will still be sustainable. Modern mining operations today are costly endeavors, often with razor-thin margins, and losing half of one’s revenue overnight would be a nightmare for any business.
And if you look at historical miner revenue in bitcoin, you can see quite clearly, the steep drop in revenue after each halving. But what’s interesting, is that if you compare that against the miner revenue in USD, there is a drop there as well, but it recovers soon thereafter as the cryptocurrency appreciates. In other words, a miner may receive less bitcoin, but that bitcoin is worth more.
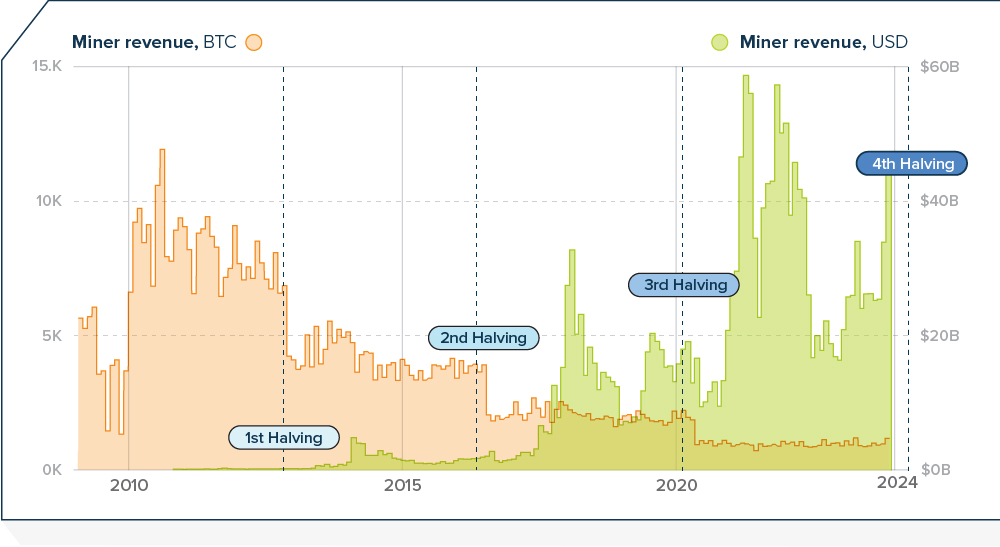
Halvings Compared
So we know that the network will continue to function after the fourth halving, but what else can we learn from previous halvings?
If we look at the percent change in market capitalization post-halvings, we can see a bit of a pattern. After both the second and third halvings, market capitalization peaked at around the year-and-half mark. The second-halving peak occurred on day 526 at around $328 billion, an increase of 3,000%, while the third-halving peak came three weeks later on day 547 at over $1.2 trillion, or an increase of just under 700%.
The post-first-halving peak happened a bit earlier, at the 372-day mark, but because the peak was so high (over 10,000%!) it is considered an outlier, and omitted to better illustrate the trend.
The 4th Bitcoin Halving Projected?
Because we know that halvings occur every 210,000 blocks and that each block takes around 10 minutes to mine, we have a good idea of when the fourth halving should happen: April 21, 2024. If the next halving follows the same pattern as the previous two, then there could be a market-capitalization peak some time during the third week of October 2025.
And with the price of bitcoin setting new records at time of writing, a lot of people will be watching very closely, indeed.
HIVE Digital is leading the way to a sustainable future for Bitcoin based on low-cost renewables.

-

 Energy3 years ago
Visualizing the Power Consumption of Bitcoin Mining
Bitcoin mining requires significant amounts of energy, but what does this consumption look like when compared to countries and companies?
-
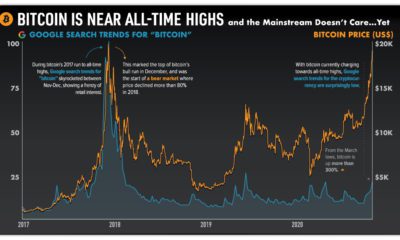
 Bitcoin3 years ago
Bitcoin is Near All-Time Highs and the Mainstream Doesn’t Care…Yet
As bitcoin charges towards all-time highs, search interest is relatively low. How much attention has bitcoin’s recent rally gotten?
-
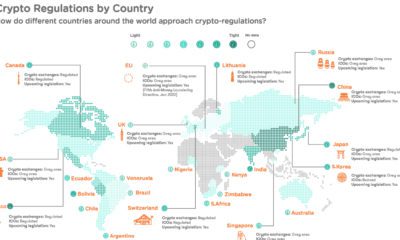
 Technology5 years ago
Mapped: Cryptocurrency Regulations Around the World
Cryptocurrency regulations are essential for the future of digital finance, making it more attractive for businesses, banks, and investors worldwide.
-
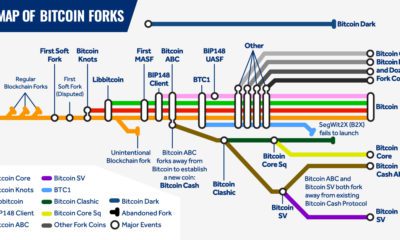
 Technology5 years ago
Mapping the Major Bitcoin Forks
Bitcoin forks play a key role in Bitcoin’s evolution as a blockchain. While some have sparked controversy, most Bitcoin forks have been a sign of growth.
-
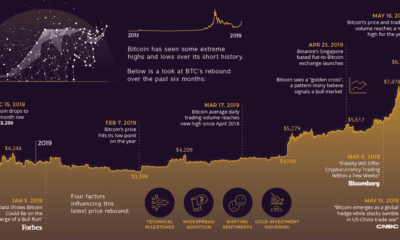
 Cryptocurrency5 years ago
The Beginning of a Bitcoin Bull Run?
After 15 months of losses and stagnation, Bitcoin has made a miraculous recovery — going on a 150% bull run since its lows in December 2018.
-

 Bitcoin5 years ago
Decentralized Finance: An Emerging Alternative to the Global Financial System
What is decentralized finance? Learn how technology is changing the rules of the game, creating the potential for a new financial system to emerge.


-

 Science1 week ago
Visualizing the Average Lifespans of Mammals
-

 Demographics2 weeks ago
The Smallest Gender Wage Gaps in OECD Countries
-

 United States2 weeks ago
Where U.S. Inflation Hit the Hardest in March 2024
-

 Green2 weeks ago
Top Countries By Forest Growth Since 2001
-

 United States2 weeks ago
Ranked: The Largest U.S. Corporations by Number of Employees
-

 Maps2 weeks ago
The Largest Earthquakes in the New York Area (1970-2024)
-

 Green2 weeks ago
Ranked: The Countries With the Most Air Pollution in 2023
-

 Green2 weeks ago
Ranking the Top 15 Countries by Carbon Tax Revenue