Technology
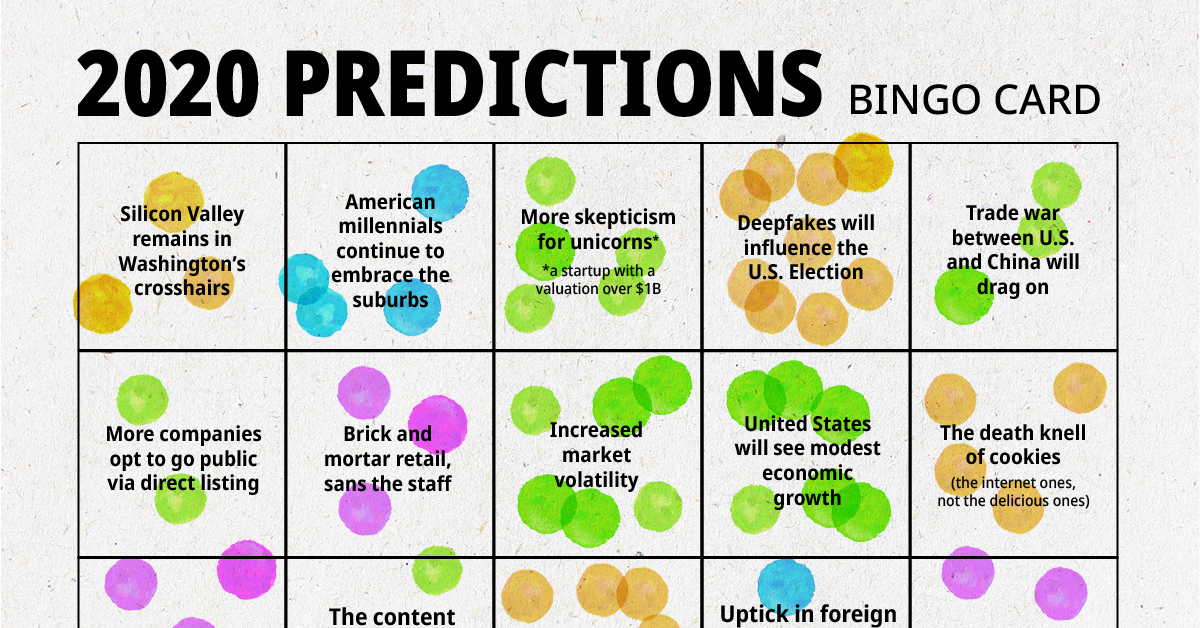
Prediction Consensus: What the Experts See Coming in 2020
Prediction Consensus: What Experts See Coming in 2020
Through the ages, humans have feared uncertainty. We’ve searched for clues in everything from entrails to tea leaves to the arrangement of heavenly bodies in the night sky.
In the modern era, data and media are the new magic 8-ball. The jury is still out on whether we’ve gotten any better at anticipating the forces that will shape the coming year, but that certainly hasn’t stopped people from trying.
Of the hundreds of forward-looking pieces of content published in the lead-up to 2020, how many of the expert predictions lined up? Was there a consensus on any particular trend, or were predictions all over the map?
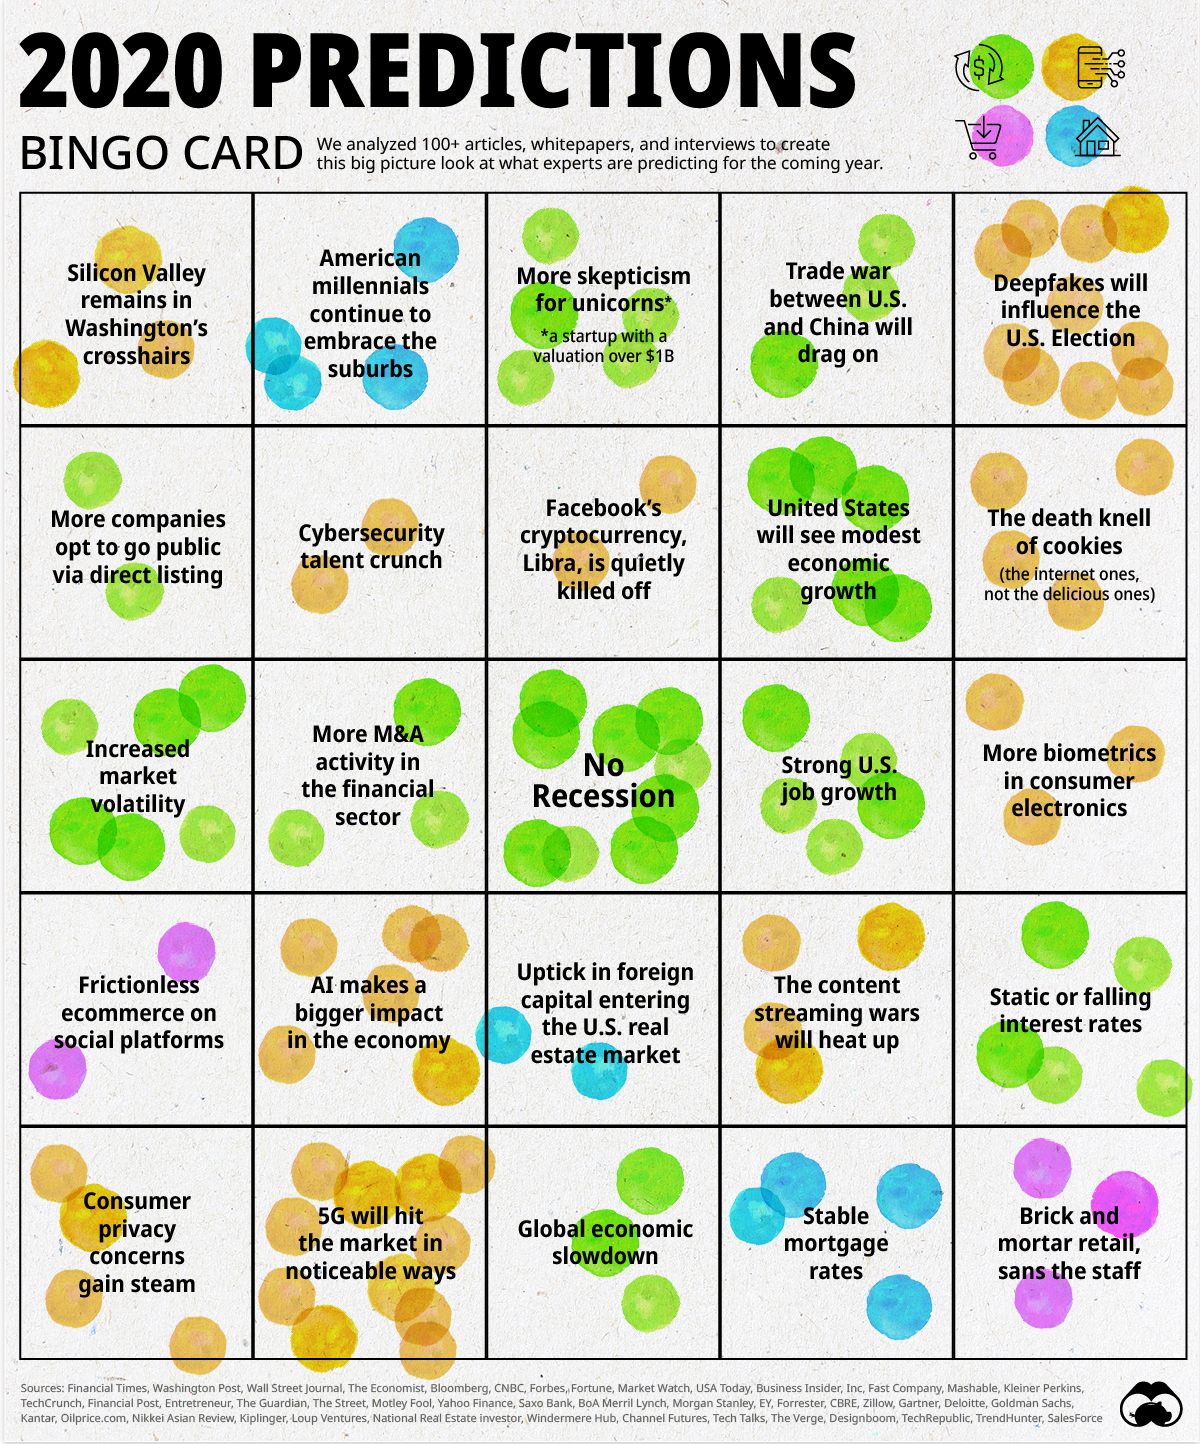
During the month of December we analyzed over 100 articles, whitepapers, and interviews to answer that question. While there was no firm consensus on where 2020 will take us, there were a few themes that appeared in multiple publications. Today’s graphic highlights these reappearing predictions, and below, we examine seven of them in more detail.
The Promise and Controversy of 5G
One technology that’s sure to capture the headlines in 2020 is 5G. Broadband speeds of over one gigabit per second will become a reality when 5G technology rolls out across the country, without the cable that currently connects most homes. This prediction is a slam dunk, as some carriers are already testing the technology in select neighborhoods around the United States.
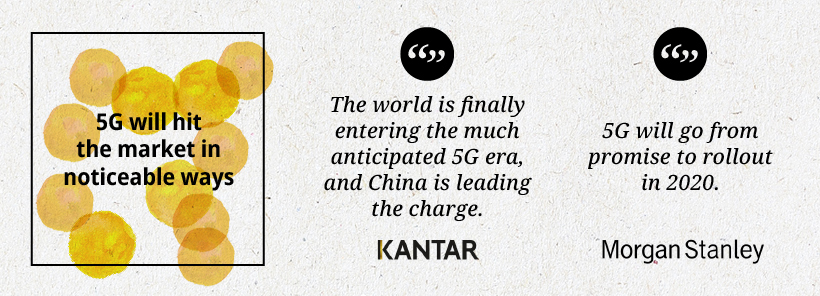
Experts also predict that a wave of 5G-enabled smartphone and IoT products will become commercially available in 2020.
The wild card in this 5G story will be guessing which companies end up building out the new network. Huawei was in a strong position to lead the charge, but the company has been stonewalled in a number countries – most notably the United States, Australia, and Japan. Whether due to national security concerns or protectionism, Chinese companies may continue to face an uphill battle in Western markets.
Fake News 2.0
While many predictions for 2020 were fueled by excitement for new technologies, there was one that was decidedly more ominous – the proliferation of deepfakes. Simply put, deepfakes are videos that harness artificial intelligence to create a convincing likeness of a real person.
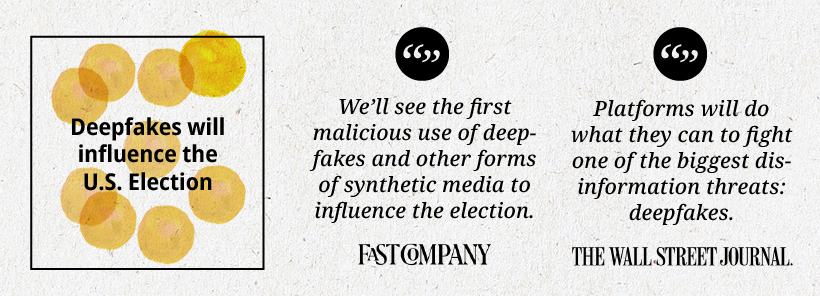
With the U.S. presidential election just around the corner, many experts fear that deepfakes are going to do serious damage, manipulating public opinion on both sides of the political spectrum. Unlike fake news, which often comes with obvious visual cues to help determine authenticity, even deepfakes created using free online tools are extremely convincing. If predictions come true, the lead-up to the U.S. election could be a wild ride.
Consumerism in Flux
The late 2010’s were a turbulent time for retail. The rise of ecommerce and shifting consumer preferences combined to cause a “retailpocalypse”, and many brands are still struggling to evolve their brick and mortar strategy to compete in an Amazon Prime world. Experts are predicting new evolutions for physical stores that are powered by technology instead of human employees.

The incarnation of this approach that will likely garner the most attention will be the next wave of cashierless Amazon Go locations opening in cities around the country.
Experts also predict that brands will mimic the example of Amazon’s Whole Foods, and incorporate online order pick-up locations within their physical stores. Increasingly, the line between ecommerce and traditional retail is blurring.
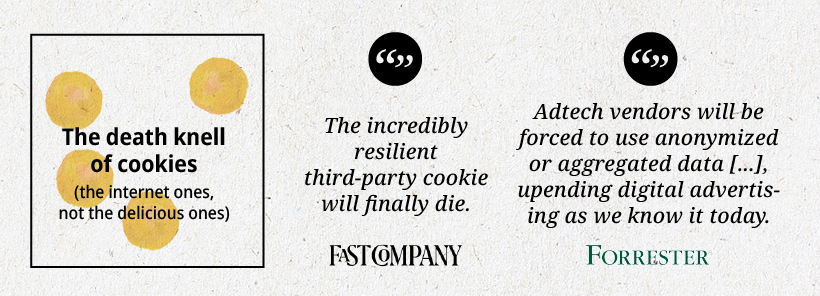
The Cookie Begins to Crumble
In 2019, approximately $330 billion was spent on digital advertising, but privacy regulations such as GDPR and the CCPA – California’s new privacy law – are causing massive disruption and upheaval in this industry.
For many years, the humble internet cookie has done the heavy lifting in collecting your personal data from online activity. This data is what advertisers use to reach you as you scroll Instagram or read articles online. Already, changes to Safari and Firefox wiped out about 40% of all third-party cookies, and in a world where people need to physically click a button on each site to allow cookies, it’s unclear how viable the technology will be as privacy measures are enacted.
The Call of the Picket Fence
One of main predictions going into 2020 is that starter homes will be a leading category in new home builds. For millions of millennials around the country in the rental market, a starter home – the first residence a person or family can afford to purchase, often using a combination of savings and mortgage financing – will begin to look more appealing.
Rent in American cities has been marching upward for nearly a decade, and the promise of more space and entry into the home ownership market may lure more of this generational cohort to the suburbs.

Also on the topic of real estate, a few experts noted that even if there is an economic downturn in 2020, the housing market is unlikely to take a big hit.
All Eyes on IPOs
Despite experiencing a rough patch in 2019, SoftBank and its gargantuan Vision Fund will remain one of the most powerful forces in Silicon Valley this year. Masayoshi Son, Softbank’s enigmatic CEO, appears to have adopted a more pragmatic approach, citing a company’s “ability to turn a profit in the future” as a yardstick of evaluating the value of an investment.
Experts predict that in light of the very public PR disasters of unicorns Uber and WeWork, investors will be much more skeptical of high-valuation IPOs.
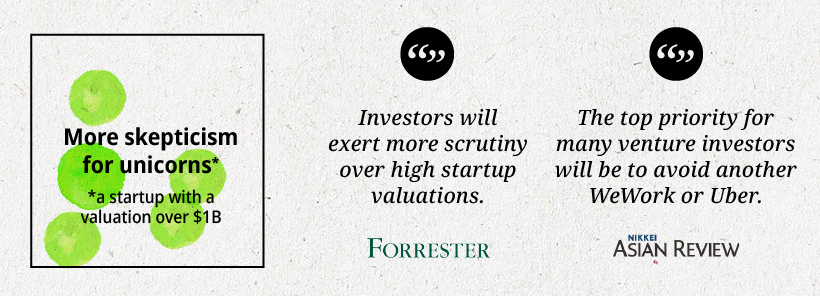
In 2020, more companies are predicted to opt for a direct listing to go public.
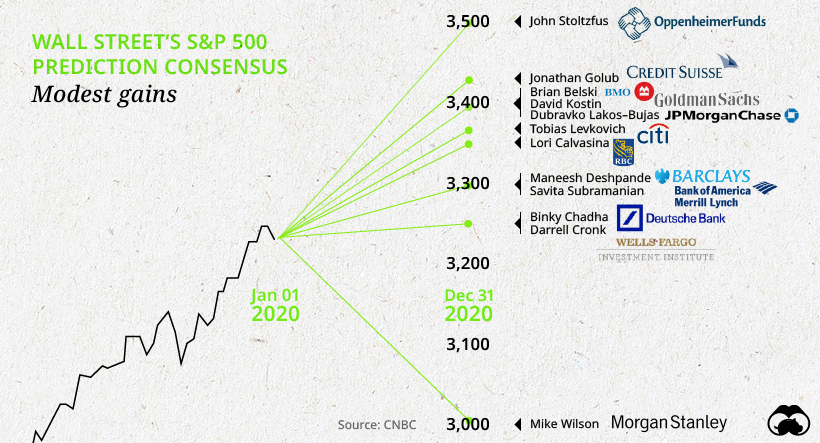
What Goes Up?
When the ball dropped to usher in 2019, market sentiment was leaning toward an impending recession. A year later, the economic expansion is still underway, and many experts now have a more positive outlook for 2020.
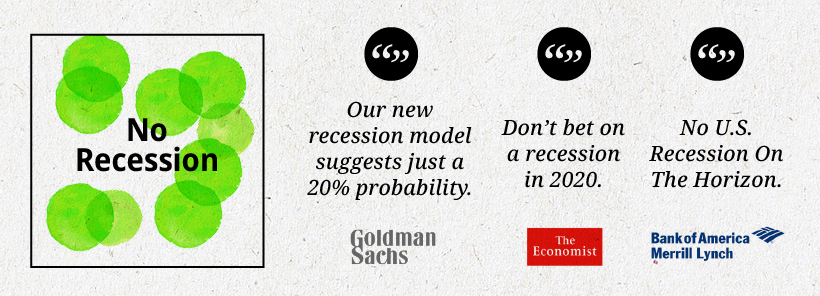
The majority of predictions we analyzed foresaw a year of continued job growth and modest gains in the stock market. Here’s a look at S&P 500 end target predictions from some of Wall Street’s top strategists:
The Elephant in the Oval
One prediction nobody seemed particularly keen to make was on the result of the impending U.S. presidential election.
Experts are likely happy to take a wait-and-see approach until the Democratic nominee is announced. Also looming in the back of people’s minds might be the memory of 2016, which was a powerful reminder that even predictions that seem like a sure thing don’t always pan out as expected.
[Experts] can’t predict the markets with any useful consistency, any more than the gizzard squeezers could tell the Roman emperors when the Huns would attack.
– Peter Lynch
A note on methodology: To make sure we captured a robust cross section of predictions for the coming year, we spent the month of December tracking down and analyzing hundreds of articles, whitepapers, and interviews from respected sources. For this exercise, we chose to focus on four broad, interconnected themes – the economy, consumerism, real estate, and technology. In the end, we analyzed 100+ published pieces, and captured 150+ predictions. We focused on content from media publications in Comscore’s top 100, major banks and consultancies, and brands and agencies with high-quality thought leadership. In the end, we highlighted the 25 predictions that appeared the most often.


Technology
All of the Grants Given by the U.S. CHIPS Act
Intel, TSMC, and more have received billions in subsidies from the U.S. CHIPS Act in 2024.


All of the Grants Given by the U.S. CHIPS Act
This was originally posted on our Voronoi app. Download the app for free on iOS or Android and discover incredible data-driven charts from a variety of trusted sources.
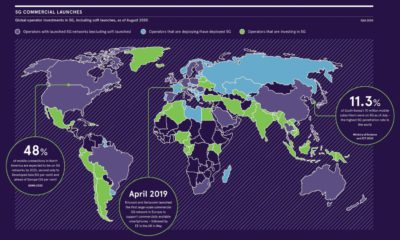
This visualization shows which companies are receiving grants from the U.S. CHIPS Act, as of April 25, 2024. The CHIPS Act is a federal statute signed into law by President Joe Biden that authorizes $280 billion in new funding to boost domestic research and manufacturing of semiconductors.
The grant amounts visualized in this graphic are intended to accelerate the production of semiconductor fabrication plants (fabs) across the United States.
Data and Company Highlights
The figures we used to create this graphic were collected from a variety of public news sources. The Semiconductor Industry Association (SIA) also maintains a tracker for CHIPS Act recipients, though at the time of writing it does not have the latest details for Micron.
| Company | Federal Grant Amount | Anticipated Investment From Company |
|---|---|---|
| 🇺🇸 Intel | $8,500,000,000 | $100,000,000,000 |
| 🇹🇼 TSMC | $6,600,000,000 | $65,000,000,000 |
| 🇰🇷 Samsung | $6,400,000,000 | $45,000,000,000 |
| 🇺🇸 Micron | $6,100,000,000 | $50,000,000,000 |
| 🇺🇸 GlobalFoundries | $1,500,000,000 | $12,000,000,000 |
| 🇺🇸 Microchip | $162,000,000 | N/A |
| 🇬🇧 BAE Systems | $35,000,000 | N/A |
BAE Systems was not included in the graphic due to size limitations
Intel’s Massive Plans
Intel is receiving the largest share of the pie, with $8.5 billion in grants (plus an additional $11 billion in government loans). This grant accounts for 22% of the CHIPS Act’s total subsidies for chip production.
From Intel’s side, the company is expected to invest $100 billion to construct new fabs in Arizona and Ohio, while modernizing and/or expanding existing fabs in Oregon and New Mexico. Intel could also claim another $25 billion in credits through the U.S. Treasury Department’s Investment Tax Credit.
TSMC Expands its U.S. Presence
TSMC, the world’s largest semiconductor foundry company, is receiving a hefty $6.6 billion to construct a new chip plant with three fabs in Arizona. The Taiwanese chipmaker is expected to invest $65 billion into the project.
The plant’s first fab will be up and running in the first half of 2025, leveraging 4 nm (nanometer) technology. According to TrendForce, the other fabs will produce chips on more advanced 3 nm and 2 nm processes.
The Latest Grant Goes to Micron
Micron, the only U.S.-based manufacturer of memory chips, is set to receive $6.1 billion in grants to support its plans of investing $50 billion through 2030. This investment will be used to construct new fabs in Idaho and New York.

-

 Debt1 week ago
How Debt-to-GDP Ratios Have Changed Since 2000
-

 Markets2 weeks ago
Ranked: The World’s Top Flight Routes, by Revenue
-

 Countries2 weeks ago
Population Projections: The World’s 6 Largest Countries in 2075
-

 Markets2 weeks ago
The Top 10 States by Real GDP Growth in 2023
-

 Demographics2 weeks ago
The Smallest Gender Wage Gaps in OECD Countries
-

 United States2 weeks ago
Where U.S. Inflation Hit the Hardest in March 2024
-

 Green2 weeks ago
Top Countries By Forest Growth Since 2001
-

 United States2 weeks ago
Ranked: The Largest U.S. Corporations by Number of Employees