
See how much the debt-to-GDP ratios of advanced economies have grown (or shrank) since the year 2000.


click for more →


Scan with your phone's camera or QR code app to view
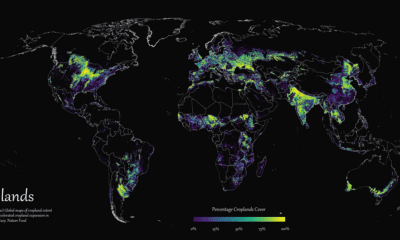

Where are the world's croplands located? This detailed map highlights the world’s cropland cover as of 2019.


When is the most dangerous time to drive on American roads? We break down the data by hour, day, month, and state.


From cultural events that dominated headlines to geopolitical shifts and clashes, what major events defined 2023?


Global clean energy spending is projected to reach $5.6 trillion by 2030. Which renewable sources are forecast to see the most investment?
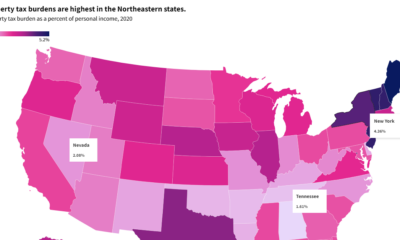

This interactive graphic shows property taxes by state in the U.S. as a percentage of personal income in 2020.


The distribution of wealth varies dramatically around the world. This graphic shows how it breaks down by wealth level in 2023.
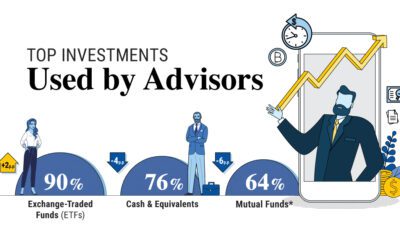

From ETFs to private equity funds, we show the top investments that financial advisors used with their clients over 2023.


What are India's top companies? This graphic showcases the country's largest 50 publicly traded companies by market capitalization.
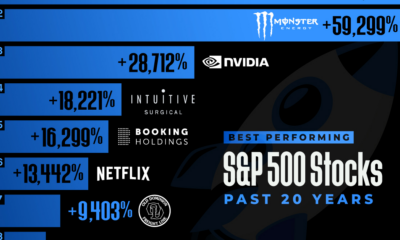

Which S&P 500 stocks have seen the highest returns over the last two decades? This graphic shows the top 15 performers.
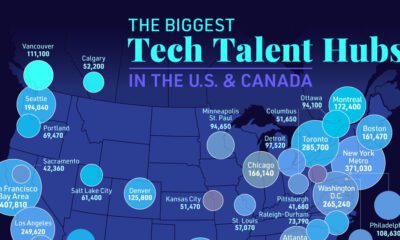

San Francisco and New York may be known as top tech talent hubs, but other cities are experiencing rapid growth in their tech labor pools.
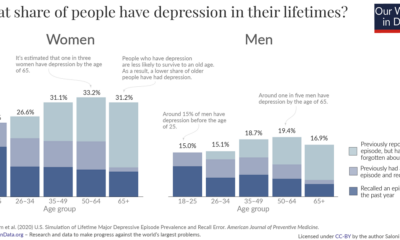

These graphics reveal how many people get depression over the course of their lives, broken down by age and sex.


These tiny particles are the building blocks of the entire universe. Explore subatomic particles and how they generate the forces of nature.
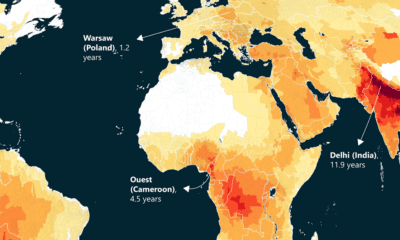

This world map of life expectancy gains shows how much longer people could potentially live by reducing pollution.
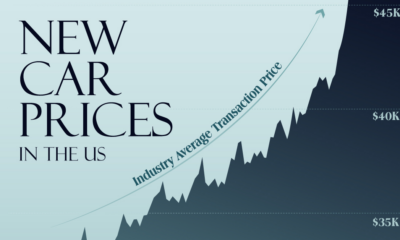

Over the last decade, new car prices in America have surged driven by supply chain constraints and inflationary pressures.
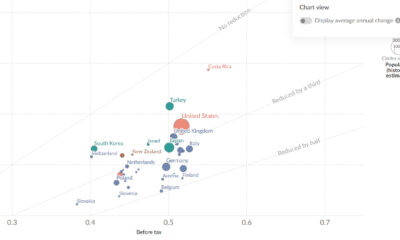

This chart shows how taxes offset income inequality by country, revealing differences in living standards around the world.


In this graphic, we map out the 24 universal character strengths, reflecting the best traits found in everyone.


What were the top data visualizations on Visual Capitalist in 2023? We highlight the best charts, maps, and infographics from the year.


 Creator Program