Markets
Chart: Income Inequality by Country, Before and After Tax
Article/Editing:
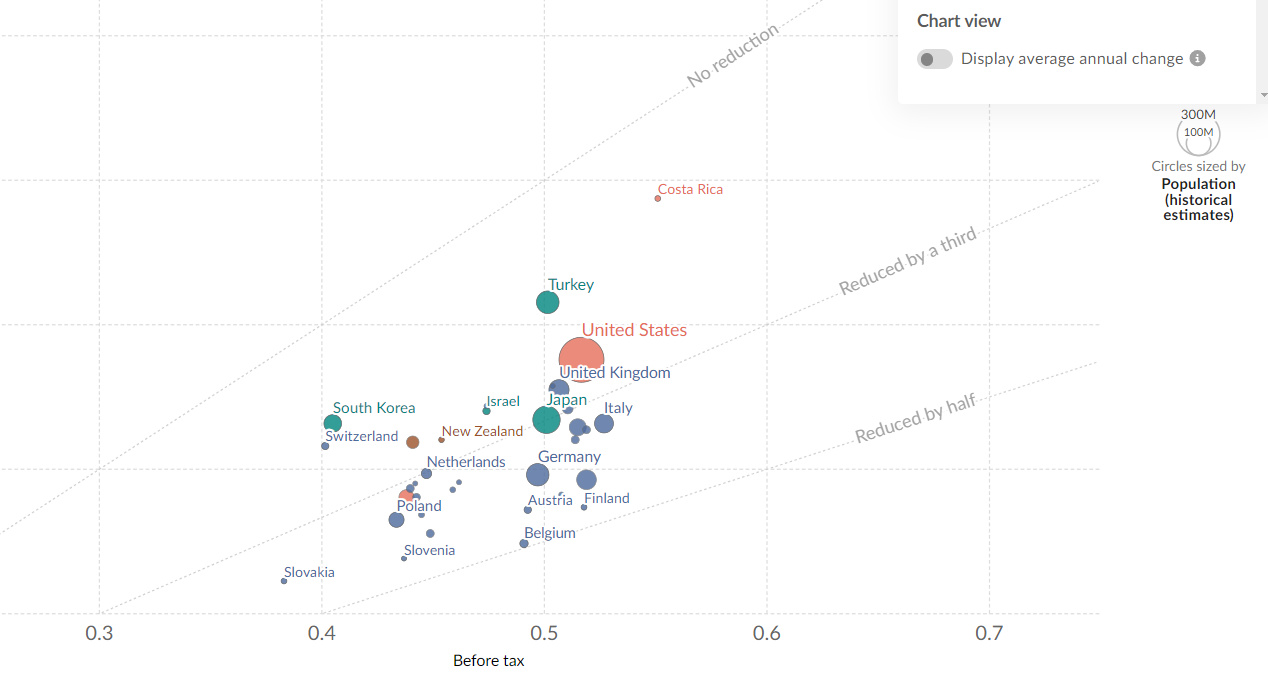
Income Inequality by Country, Before and After Tax
Do taxes impact income inequality by country?
This animated chart, from Our World in Data, shows income inequality after taxes across 45 countries—a key measure for examining differences in living standards globally.
Which Tax Systems Offset Income Inequality the Most?
First, income inequality was analyzed by using the Gini coefficient, a common measure for analyzing wealth distribution. The Gini coefficient falls on a scale of 0-100, where a score of 0 indicates equally shared income and a score of 100 implies that one person takes all.
Here’s how each country’s wealth distribution changes as a result of their tax systems, using the most recently available data:
| Country | Year | Before vs. After Tax % (Reduction in Gini Coefficient) |
|---|---|---|
| 🇧🇪 Belgium | 2020 | 49.5% |
| 🇫🇮 Finland | 2021 | 47.3% |
| 🇸🇮 Slovenia | 2020 | 45.5% |
| 🇦🇹 Austria | 2020 | 44.8% |
| 🇮🇪 Ireland | 2020 | 44.5% |
| 🇫🇷 France | 2019 | 43.7% |
| 🇨🇿 Czechia | 2020 | 43.2% |
| 🇸🇰 Slovakia | 2019 | 42.0% |
| 🇩🇪 Germany | 2019 | 40.4% |
| 🇩🇰 Denmark | 2019 | 39.8% |
| 🇵🇱 Poland | 2020 | 38.9% |
| 🇳🇴 Norway | 2021 | 37.9% |
| 🇬🇷 Greece | 2020 | 37.7% |
| 🇮🇹 Italy | 2020 | 37.2% |
| 🇭🇷 Croatia | 2020 | 37.0% |
| 🇵🇹 Portugal | 2020 | 37.0% |
| 🇭🇺 Hungary | 2020 | 36.8% |
| 🇪🇸 Spain | 2020 | 36.1% |
| 🇨🇦 Canada | 2020 | 36.1% |
| 🇪🇪 Estonia | 2020 | 35.1% |
| 🇸🇪 Sweden | 2021 | 35.0% |
| 🇱🇺 Luxembourg | 2020 | 34.4% |
| 🇳🇱 Netherlands | 2021 | 33.6% |
| 🇯🇵 Japan | 2018 | 33.3% |
| 🇷🇴 Romania | 2020 | 33.1% |
| 🇮🇸 Iceland | 2017 | 32.2% |
| 🇱🇹 Lithuania | 2004 | 31.3% |
| 🇬🇧 UK | 2020 | 30.0% |
| 🇳🇿 New Zealand | 2020 | 29.5% |
| 🇱🇹 Lithuania | 2020 | 29.2% |
| 🇨🇦 Canada | 2019 | 28.6% |
| 🇮🇱 Israel | 2020 | 28.3% |
| 🇦🇺 Australia | 2020 | 27.9% |
| 🇱🇻 Latvia | 2021 | 27.6% |
| 🇺🇸 U.S. | 2021 | 27.5% |
| 🇷🇺 Russia | 2017 | 27.0% |
| 🇧🇬 Bulgaria | 2020 | 24.1% |
| 🇨🇭 Switzerland | 2019 | 21.4% |
| 🇰🇷 South Korea | 2020 | 18.3% |
| 🇧🇷 Brazil | 2016 | 17.4% |
| 🇹🇷 Türkiye | 2019 | 17.3% |
| 🇿🇦 South Africa | 2017 | 12.8% |
| 🇨🇷 Costa Rica | 2021 | 11.6% |
| 🇨🇱 Chile | 2017 | 7.1% |
| 🇮🇳 India | 2011 | 2.6% |
As the above table shows, Belgium saw the steepest decline in income inequality, dropping by nearly half after-tax. The country’s progressive tax rate system—where taxes increase as a person’s income increases—is one factor behind this decline.
Other Nordic countries like Finland, Slovenia, and Austria, all saw notable decreases.
Income inequality also falls significantly in Ireland, where many big tech giants are incorporated due to its favorable tax policies. In fact, foreign-owned firms, including Apple and Microsoft, make up the majority of its corporate taxes.
However in 2024, the country is implementing a 15% corporate tax rate as part of a new global minimum standard.
Interestingly, in the U.S., income inequality after tax drops by almost 28%, but before-tax inequality is high. In 2019, people in the highest income quintile earned on average 14 times more than the average household. A report from the Congressional Budget Office states that transfers and taxes increased the lowest quintile household incomes by $15,100 on average.
Does Government Spending Impact Inequality?
Studies show that Gini coefficients are linked to a country’s government spending.
In this way, higher government spending contributes to a more equal distribution of income, or a lower Gini coefficient. It further shows that strong education systems increased the effectiveness of redistributive public spending.
Consider how in France, government spending makes up 58% of GDP, and in Belgium it stands at almost 54%. By contrast, it accounts for 37% of GDP in America, which has an after-tax Gini coefficient that exceeds both European countries by a notable difference.
If the U.S. were to increase government spending in efforts to reduce inequality, it would likely mean higher taxes. Given the current political climate, the odds of this appear fairly slim.

This article was published as a part of Visual Capitalist's Creator Program, which features data-driven visuals from some of our favorite Creators around the world.


Economy
Economic Growth Forecasts for G7 and BRICS Countries in 2024
The IMF has released its economic growth forecasts for 2024. How do the G7 and BRICS countries compare?


G7 & BRICS Real GDP Growth Forecasts for 2024
The International Monetary Fund’s (IMF) has released its real gross domestic product (GDP) growth forecasts for 2024, and while global growth is projected to stay steady at 3.2%, various major nations are seeing declining forecasts.
This chart visualizes the 2024 real GDP growth forecasts using data from the IMF’s 2024 World Economic Outlook for G7 and BRICS member nations along with Saudi Arabia, which is still considering an invitation to join the bloc.
Get the Key Insights of the IMF’s World Economic Outlook
Want a visual breakdown of the insights from the IMF’s 2024 World Economic Outlook report?
This visual is part of a special dispatch of the key takeaways exclusively for VC+ members.
Get the full dispatch of charts by signing up to VC+.
Mixed Economic Growth Prospects for Major Nations in 2024
Economic growth projections by the IMF for major nations are mixed, with the majority of G7 and BRICS countries forecasted to have slower growth in 2024 compared to 2023.
Only three BRICS-invited or member countries, Saudi Arabia, the UAE, and South Africa, have higher projected real GDP growth rates in 2024 than last year.
| Group | Country | Real GDP Growth (2023) | Real GDP Growth (2024P) |
|---|---|---|---|
| G7 | 🇺🇸 U.S. | 2.5% | 2.7% |
| G7 | 🇨🇦 Canada | 1.1% | 1.2% |
| G7 | 🇯🇵 Japan | 1.9% | 0.9% |
| G7 | 🇫🇷 France | 0.9% | 0.7% |
| G7 | 🇮🇹 Italy | 0.9% | 0.7% |
| G7 | 🇬🇧 UK | 0.1% | 0.5% |
| G7 | 🇩🇪 Germany | -0.3% | 0.2% |
| BRICS | 🇮🇳 India | 7.8% | 6.8% |
| BRICS | 🇨🇳 China | 5.2% | 4.6% |
| BRICS | 🇦🇪 UAE | 3.4% | 3.5% |
| BRICS | 🇮🇷 Iran | 4.7% | 3.3% |
| BRICS | 🇷🇺 Russia | 3.6% | 3.2% |
| BRICS | 🇪🇬 Egypt | 3.8% | 3.0% |
| BRICS-invited | 🇸🇦 Saudi Arabia | -0.8% | 2.6% |
| BRICS | 🇧🇷 Brazil | 2.9% | 2.2% |
| BRICS | 🇿🇦 South Africa | 0.6% | 0.9% |
| BRICS | 🇪🇹 Ethiopia | 7.2% | 6.2% |
| 🌍 World | 3.2% | 3.2% |
China and India are forecasted to maintain relatively high growth rates in 2024 at 4.6% and 6.8% respectively, but compared to the previous year, China is growing 0.6 percentage points slower while India is an entire percentage point slower.
On the other hand, four G7 nations are set to grow faster than last year, which includes Germany making its comeback from its negative real GDP growth of -0.3% in 2023.
Faster Growth for BRICS than G7 Nations
Despite mostly lower growth forecasts in 2024 compared to 2023, BRICS nations still have a significantly higher average growth forecast at 3.6% compared to the G7 average of 1%.
While the G7 countries’ combined GDP is around $15 trillion greater than the BRICS nations, with continued higher growth rates and the potential to add more members, BRICS looks likely to overtake the G7 in economic size within two decades.
BRICS Expansion Stutters Before October 2024 Summit
BRICS’ recent expansion has stuttered slightly, as Argentina’s newly-elected president Javier Milei declined its invitation and Saudi Arabia clarified that the country is still considering its invitation and has not joined BRICS yet.
Even with these initial growing pains, South Africa’s Foreign Minister Naledi Pandor told reporters in February that 34 different countries have submitted applications to join the growing BRICS bloc.
Any changes to the group are likely to be announced leading up to or at the 2024 BRICS summit which takes place October 22-24 in Kazan, Russia.
Get the Full Analysis of the IMF’s Outlook on VC+
This visual is part of an exclusive special dispatch for VC+ members which breaks down the key takeaways from the IMF’s 2024 World Economic Outlook.
For the full set of charts and analysis, sign up for VC+.

-

 Debt1 week ago
How Debt-to-GDP Ratios Have Changed Since 2000
-

 Countries2 weeks ago
Population Projections: The World’s 6 Largest Countries in 2075
-

 Markets2 weeks ago
The Top 10 States by Real GDP Growth in 2023
-

 Demographics2 weeks ago
The Smallest Gender Wage Gaps in OECD Countries
-

 United States2 weeks ago
Where U.S. Inflation Hit the Hardest in March 2024
-

 Green2 weeks ago
Top Countries By Forest Growth Since 2001
-

 United States2 weeks ago
Ranked: The Largest U.S. Corporations by Number of Employees
-

 Maps2 weeks ago
The Largest Earthquakes in the New York Area (1970-2024)