Misc
Mapped: The Most Dangerous Time to Drive in Each U.S. State
Article/Editing:
The Most Dangerous Time to Drive in Each U.S. State
Thousands of commuters around the world lose their lives in vehicular accidents each year, and in the U.S., the most dangerous time to drive can actually depend on which state you’re in.
According to the CDC, car crashes are the eighth leading cause of death globally, and the leading cause for young people between the ages of 5–29 years old. Each day, the U.S. alone sees an average of 102 fatal traffic accidents.
This graphic by Clunker Junker uses data from the National Highway Traffic Safety Administration (NHTSA) to identify the most dangerous time to drive in each state of the country, based on traffic fatalities.
The Deadly Hours
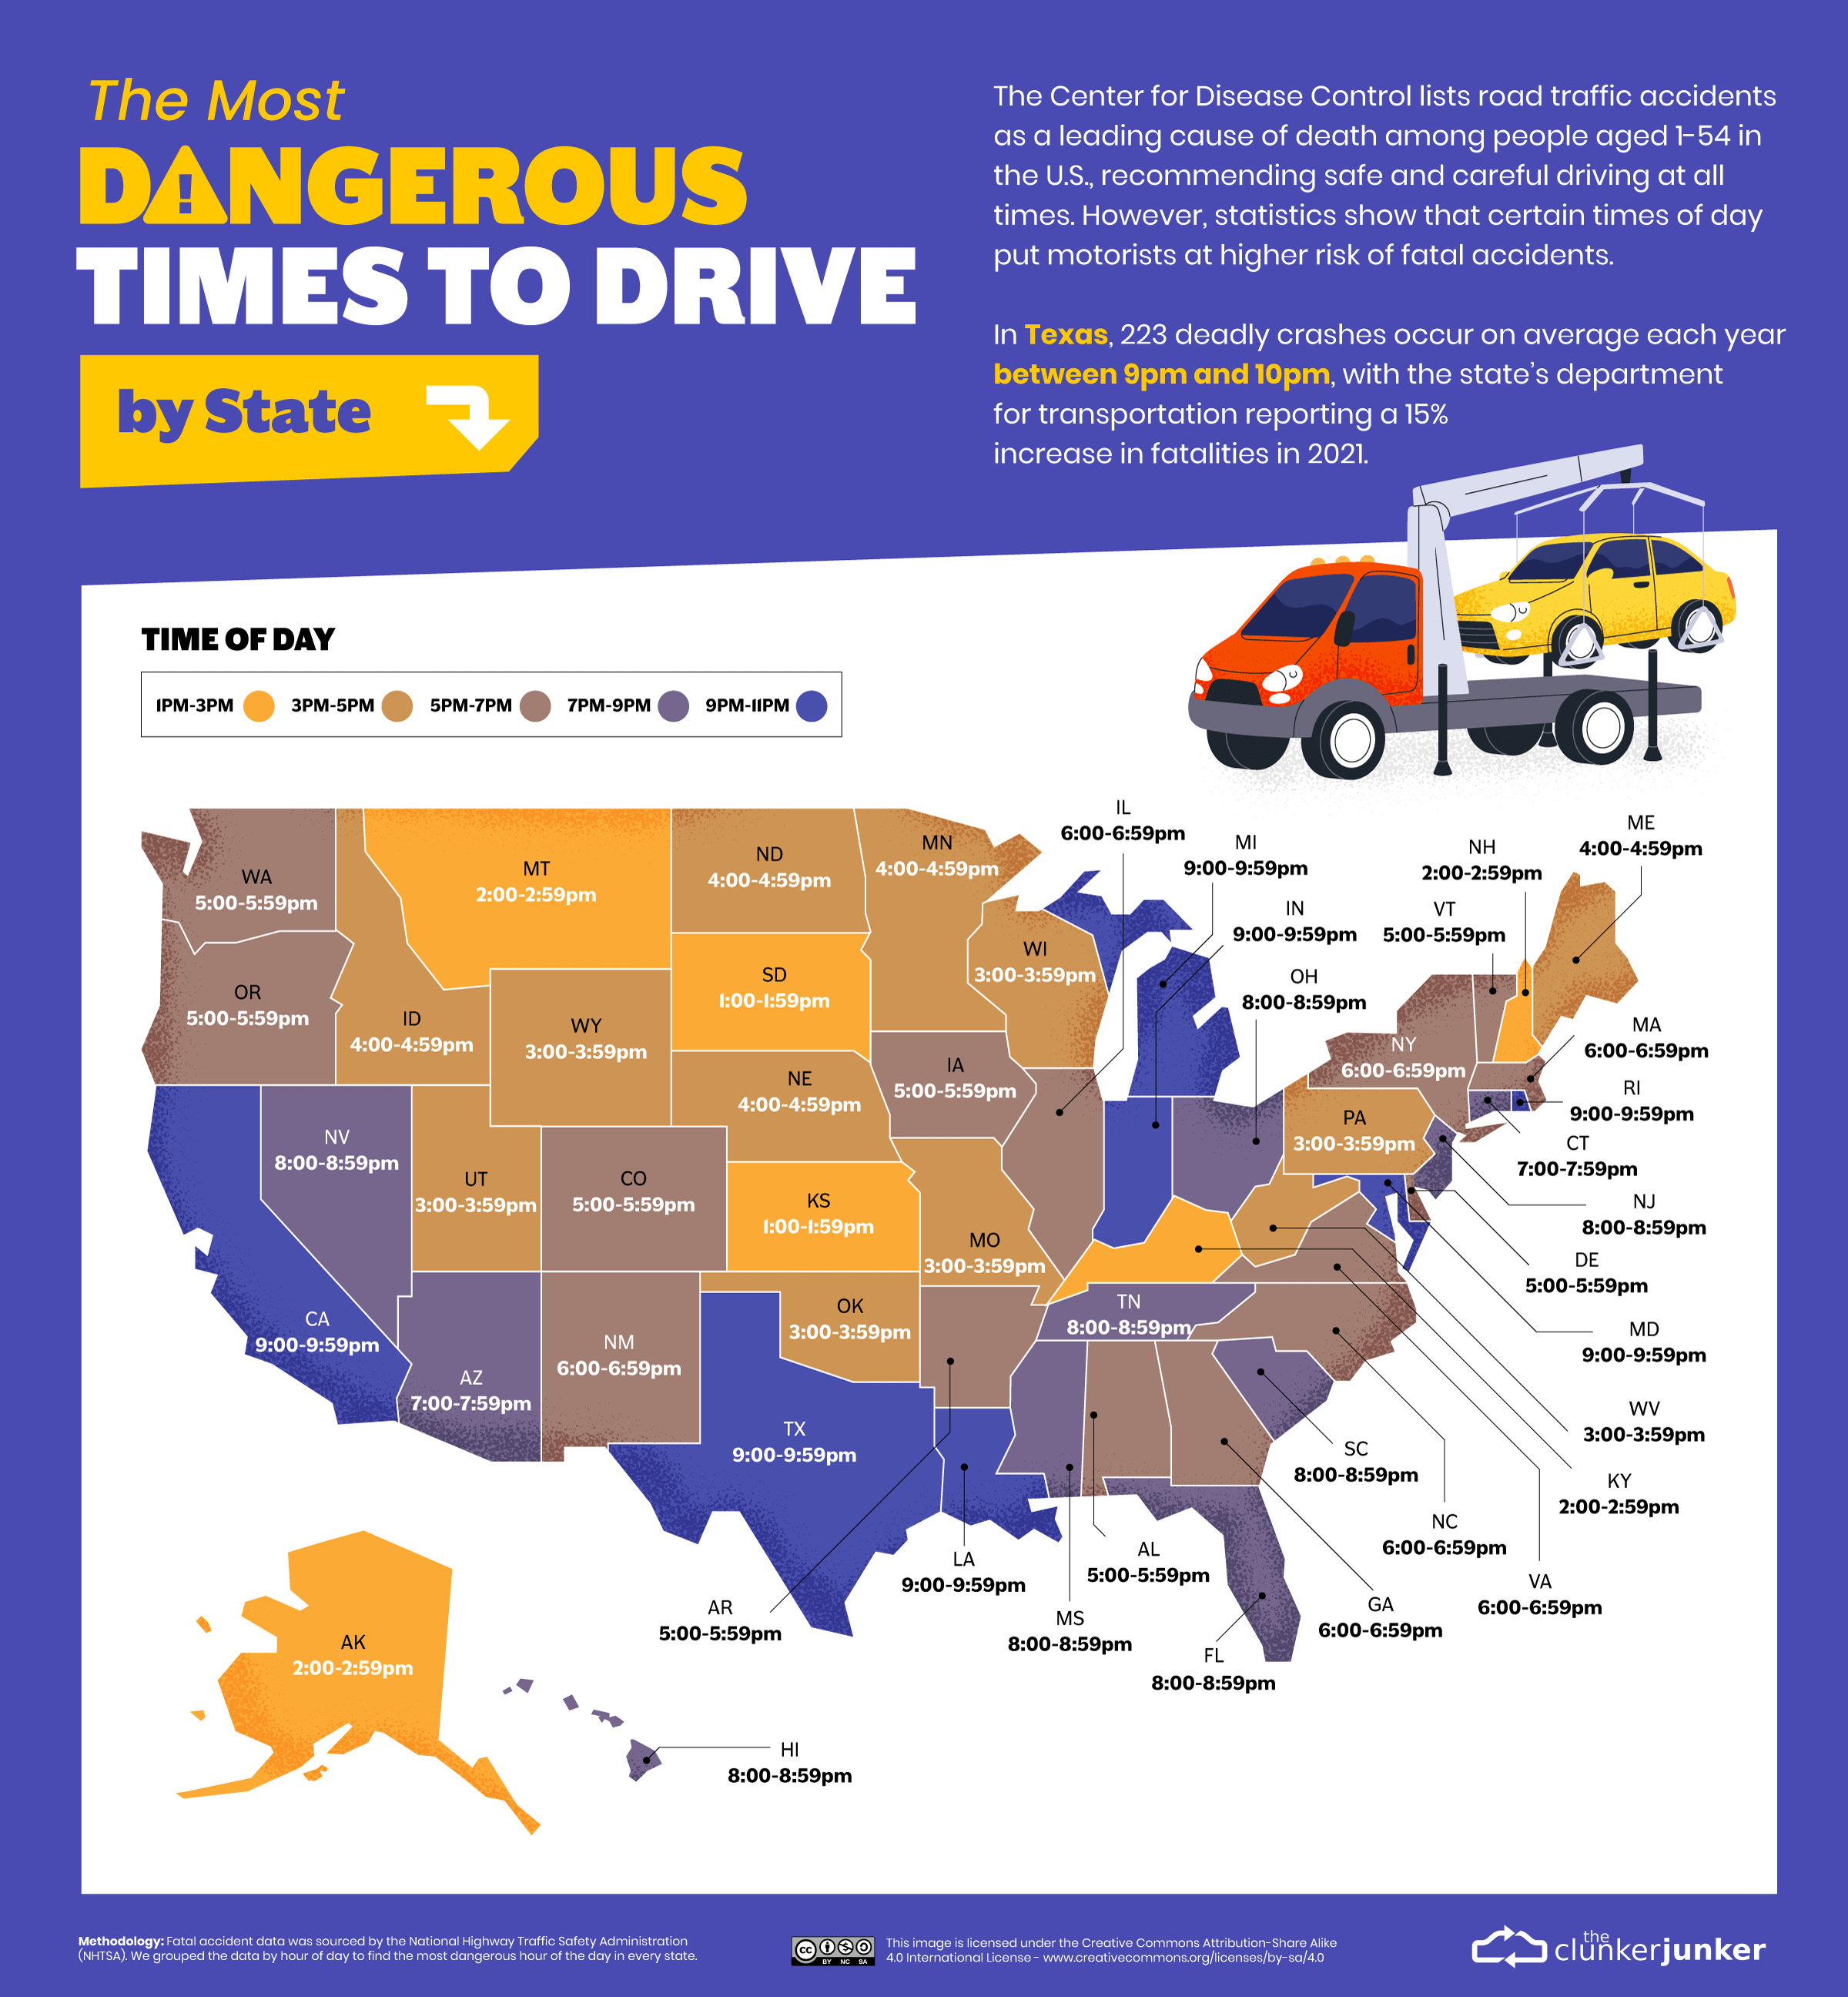
On average, U.S. commuters lose over 50 hours of their time in rush hour traffic every year. In addition to being a frustrating drive, NHTSA data found that this time frame is also the most dangerous in some states.
The number of fatal traffic accidents across various parts of the U.S. increases after 5pm, peaking between 9pm and 10pm.
| State | Most Dangerous Time to Drive |
|---|---|
| Alabama | 5:00‒5:59 p.m. |
| Alaska | 2:00‒2:59 p.m. |
| Arizona | 7:00‒7:59 p.m. |
| Arkansas | 5:00‒5:59 p.m. |
| California | 9:00‒9:59 p.m. |
| Colorado | 5:00‒5:59 p.m. |
| Connecticut | 7:00‒7:59 p.m. |
| Delaware | 5:00‒5:59 p.m. |
| Florida | 8:00‒8:59 p.m. |
| Georgia | 6:00‒6:59 p.m. |
| Hawaii | 8:00‒8:59 p.m. |
| Idaho | 4:00‒4:59 p.m. |
| Illinois | 6:00‒6:59 p.m. |
| Indiana | 9:00‒9:59 p.m. |
| Iowa | 5:00‒5:59 p.m. |
| Kansas | 1:00‒1:59 p.m. |
| Kentucky | 2:00‒2:59 p.m. |
| Louisiana | 9:00‒9:59 p.m. |
| Maine | 4:00‒4:59 p.m. |
| Maryland | 9:00‒9:59 p.m. |
| Massachusetts | 6:00‒6:59 p.m. |
| Michigan | 9:00‒9:59 p.m. |
| Minnesota | 4:00‒4:59 p.m. |
| Mississippi | 8:00‒8:59 p.m. |
| Missouri | 3:00‒3:59 p.m. |
| Montana | 2:00‒2:59 p.m. |
| Nebraska | 4:00‒4:59 p.m. |
| Nevada | 8:00‒8:59 p.m. |
| New Hampshire | 2:00‒2:59 p.m. |
| New Jersey | 8:00‒8:59 p.m. |
| New Mexico | 6:00‒6:59 p.m. |
| New York | 6:00‒6:59 p.m. |
| North Carolina | 6:00‒6:59 p.m. |
| North Dakota | 4:00‒4:59 p.m. |
| Ohio | 8:00‒8:59 p.m. |
| Oklahoma | 3:00‒3:59 p.m. |
| Oregon | 5:00‒5:59 p.m. |
| Pennsylvania | 3:00‒3:59 p.m. |
| Rhode Island | 9:00‒9:59 p.m. |
| South Carolina | 8:00‒8:59 p.m. |
| South Dakota | 1:00‒1:59 p.m. |
| Tennessee | 8:00‒8:59 p.m. |
| Texas | 9:00‒9:59 p.m. |
| Utah | 3:00‒3:59 p.m. |
| Vermont | 5:00‒5:59 p.m. |
| Virginia | 6:00‒6:59 p.m. |
| Washington | 5:00‒5:59 p.m. |
| West Virginia | 3:00‒3:59 p.m. |
| Wisconsin | 3:00‒3:59 p.m. |
| Wyoming | 3:00‒3:59 p.m. |
This is reported to be an outcome of various factors: low visibility at night, glaring headlights, more cars on the road, and a higher number of drunk drivers. In some states, regional geography and weather also contribute to dangerous road conditions, including hills and mountains, rain, snow, and strong winds.
Another factor is congestion. More populated states with longer average commutes like California and Maryland had the most dangerous time to drive as later (between 9 p.m. to 10 p.m.), while central states with smaller populations like Kansas and South Dakota had earlier peak dangerous times (between 1 p.m. and 2 p.m.)
The safest times to drive across all states? Early in the morning from 3 a.m. to 5 a.m.
The Most Dangerous Time to Drive by Month and Day
While holidays are a time for relaxation and celebration, they can be hazardous on the roads.
According to NHTSA data, the summer and fall months are the most dangerous by average fatal accidents.
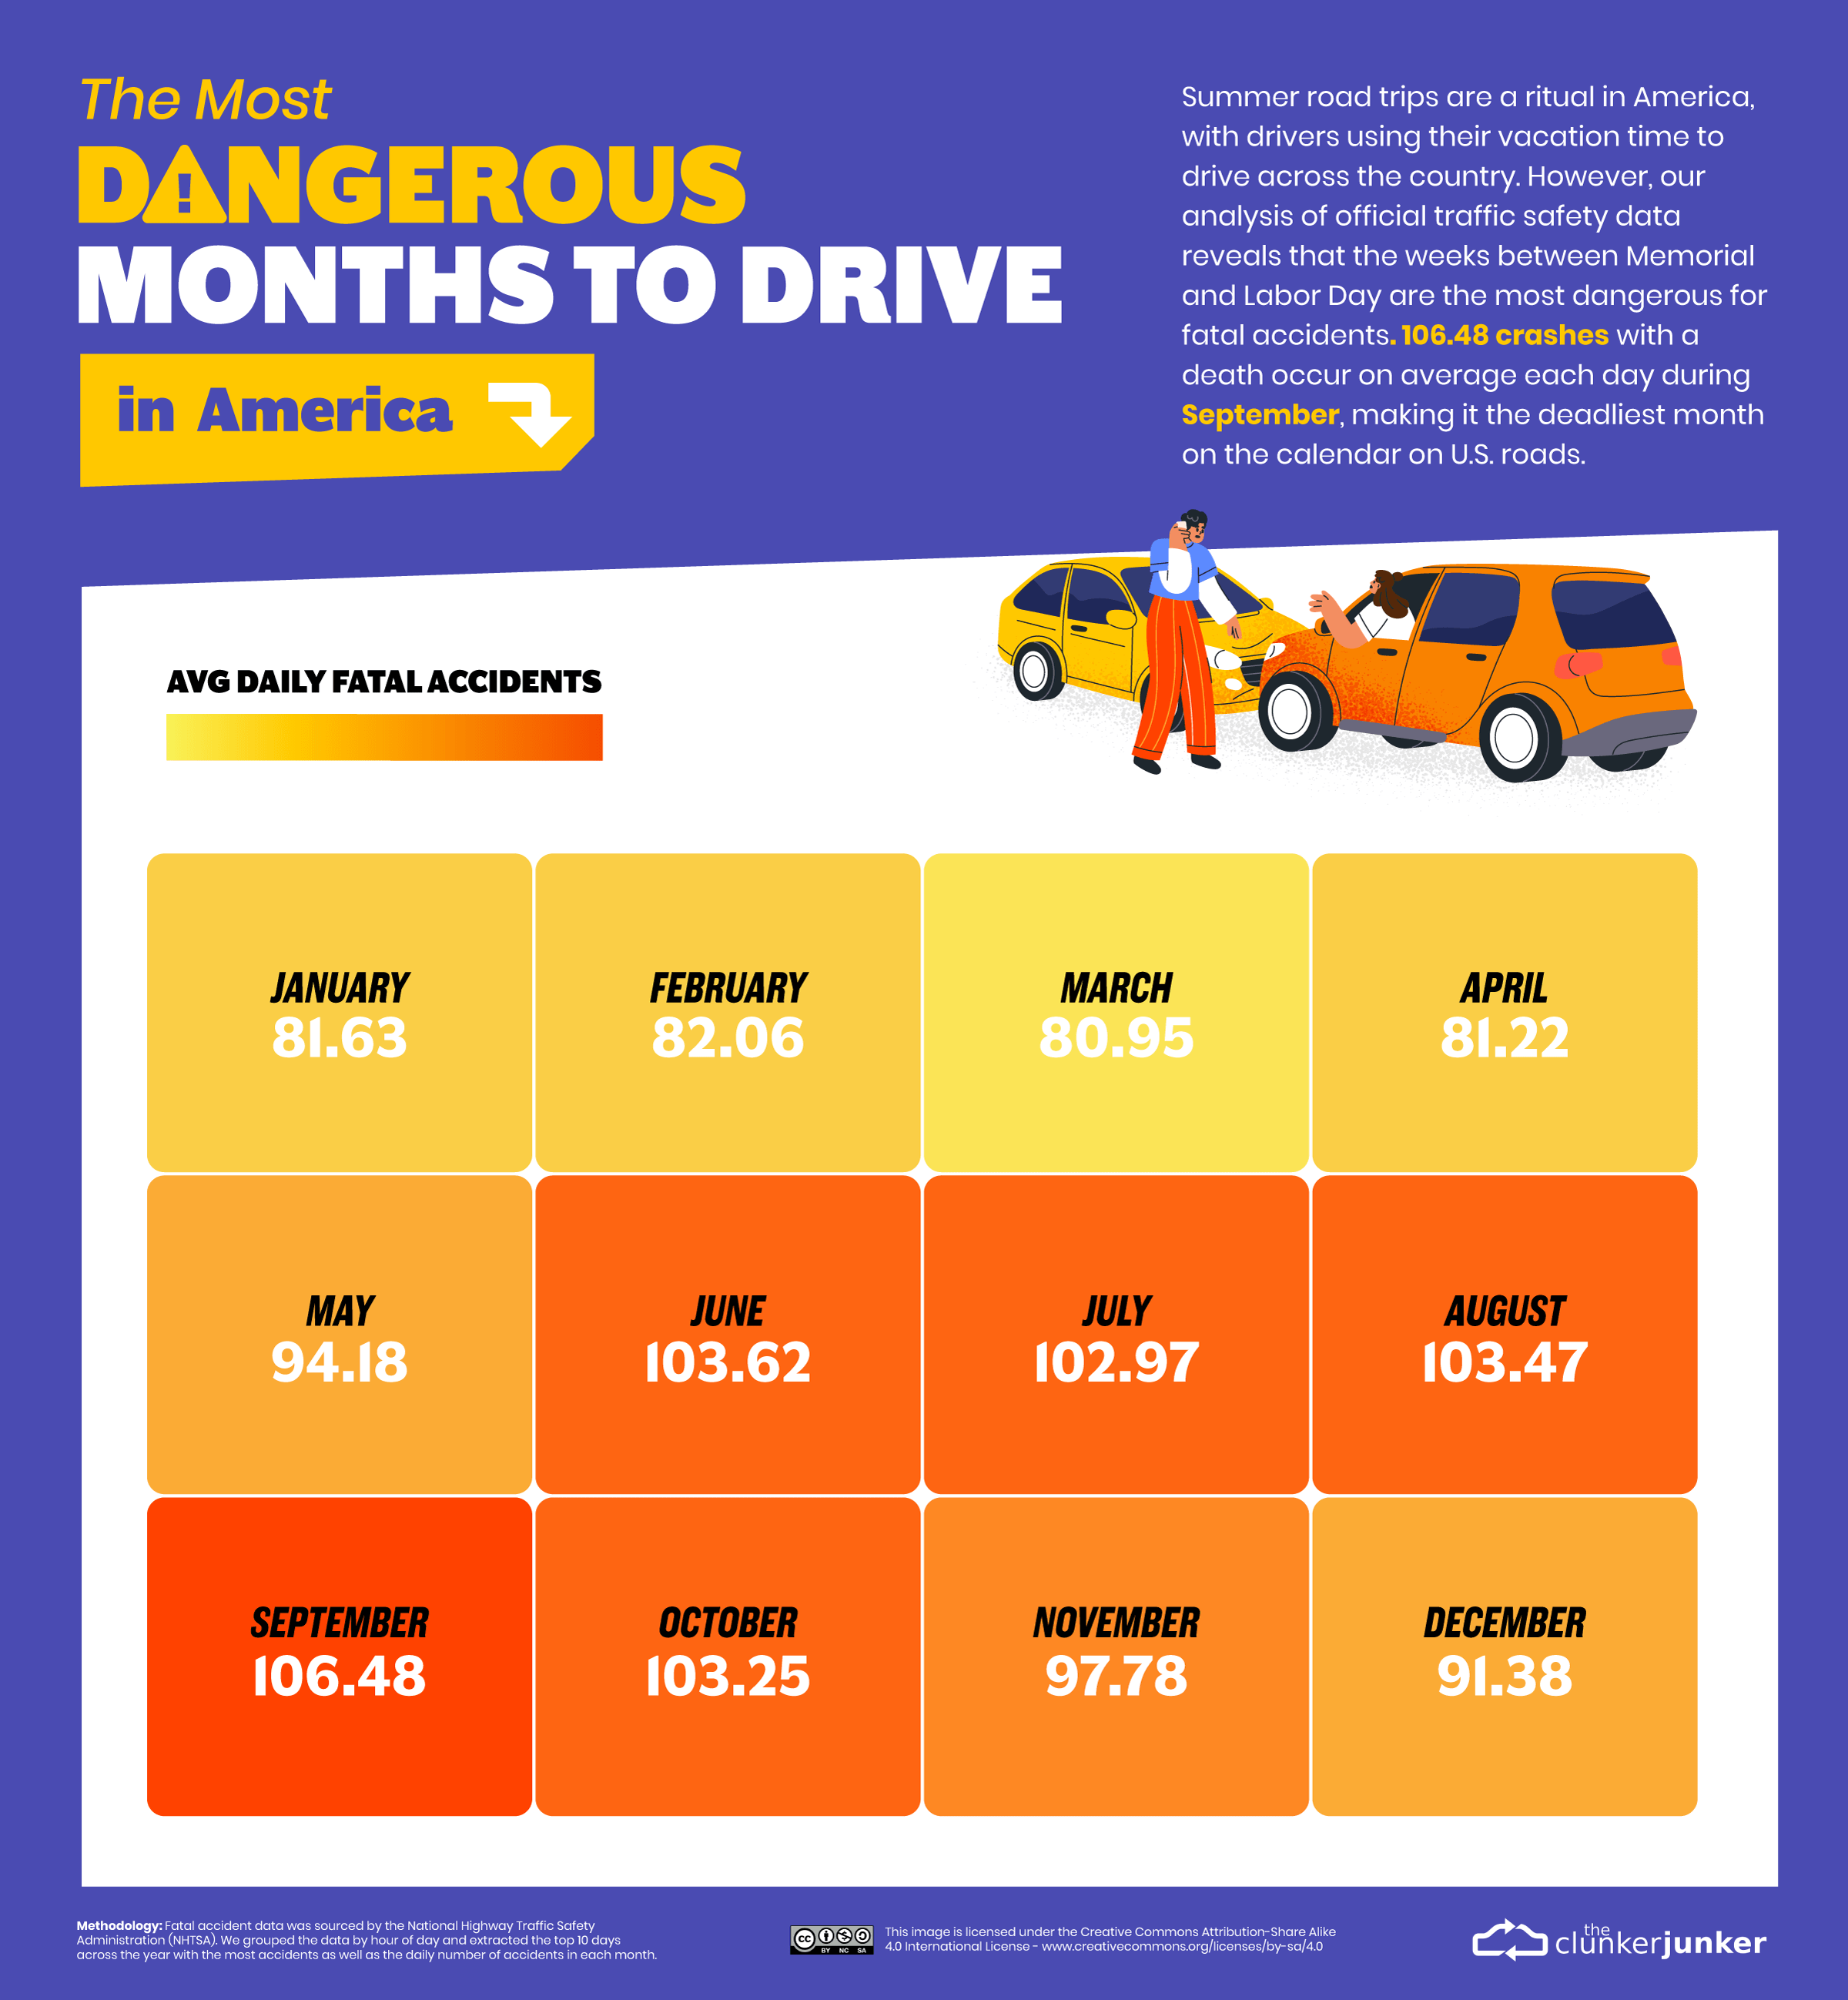
June through August are the peak months of vacation travel in the U.S. and see increased traffic (often on high-speed highways and unfamiliar roads) and fatalities. But September is actually the most dangerous month to drive in America, as the Labor Day weekend and the new school term bring new drivers to the roads.
Other popular U.S. holidays, including the Fourth of July, New Year’s Eve, and Halloween, are also more dangerous than average. In addition to increased instances of drinking and driving, many holidays involve long-distance travel, leading to fatigue.
And finally, according to the NHTSA, the U.S. sees an average of 4.68 fatal accidents on Saturdays making it the most dangerous day. This reaches a peak of over seven fatal accidents between 9 and 10pm every Saturday.

This article was published as a part of Visual Capitalist's Creator Program, which features data-driven visuals from some of our favorite Creators around the world.


VC+
VC+: Get Our Key Takeaways From the IMF’s World Economic Outlook
A sneak preview of the exclusive VC+ Special Dispatch—your shortcut to understanding IMF’s World Economic Outlook report.

Have you read IMF’s latest World Economic Outlook yet? At a daunting 202 pages, we don’t blame you if it’s still on your to-do list.
But don’t worry, you don’t need to read the whole April release, because we’ve already done the hard work for you.
To save you time and effort, the Visual Capitalist team has compiled a visual analysis of everything you need to know from the report—and our VC+ Special Dispatch is available exclusively to VC+ members. All you need to do is log into the VC+ Archive.
If you’re not already subscribed to VC+, make sure you sign up now to access the full analysis of the IMF report, and more (we release similar deep dives every week).
For now, here’s what VC+ members get to see.
Your Shortcut to Understanding IMF’s World Economic Outlook
With long and short-term growth prospects declining for many countries around the world, this Special Dispatch offers a visual analysis of the key figures and takeaways from the IMF’s report including:
- The global decline in economic growth forecasts
- Real GDP growth and inflation forecasts for major nations in 2024
- When interest rate cuts will happen and interest rate forecasts
- How debt-to-GDP ratios have changed since 2000
- And much more!

Get the Full Breakdown in the Next VC+ Special Dispatch
VC+ members can access the full Special Dispatch by logging into the VC+ Archive, where you can also check out previous releases.
Make sure you join VC+ now to see exclusive charts and the full analysis of key takeaways from IMF’s World Economic Outlook.
Don’t miss out. Become a VC+ member today.
What You Get When You Become a VC+ Member
VC+ is Visual Capitalist’s premium subscription. As a member, you’ll get the following:
- Special Dispatches: Deep dive visual briefings on crucial reports and global trends
- Markets This Month: A snappy summary of the state of the markets and what to look out for
- The Trendline: Weekly curation of the best visualizations from across the globe
- Global Forecast Series: Our flagship annual report that covers everything you need to know related to the economy, markets, geopolitics, and the latest tech trends
- VC+ Archive: Hundreds of previously released VC+ briefings and reports that you’ve been missing out on, all in one dedicated hub
You can get all of the above, and more, by joining VC+ today.

-

 Debt1 week ago
How Debt-to-GDP Ratios Have Changed Since 2000
-

 Markets2 weeks ago
Ranked: The World’s Top Flight Routes, by Revenue
-

 Countries2 weeks ago
Population Projections: The World’s 6 Largest Countries in 2075
-

 Markets2 weeks ago
The Top 10 States by Real GDP Growth in 2023
-

 Demographics2 weeks ago
The Smallest Gender Wage Gaps in OECD Countries
-

 United States2 weeks ago
Where U.S. Inflation Hit the Hardest in March 2024
-

 Green2 weeks ago
Top Countries By Forest Growth Since 2001
-

 United States2 weeks ago
Ranked: The Largest U.S. Corporations by Number of Employees