
We visualized product categories that saw the highest % increase in price due to U.S. inflation as of March 2024.


click for more →


Scan with your phone's camera or QR code app to view


AI and edge computing are some of the factors behind the stunning growth of the GPU cloud computing market, predicted to hit $25.5B by 2030.
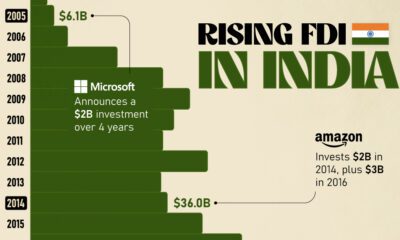

Mirroring the country's rapid economic growth, India's FDI (foreign direct investment) inflows have skyrocketed over the last twenty years.


Major financial centers—London, Singapore, and Hong Kong—feature in these rankings of cities with the most millionaires.
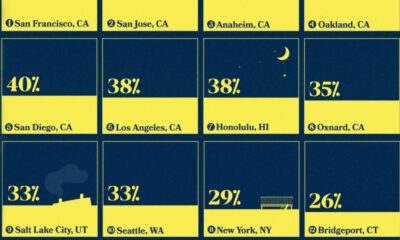

We highlight the top 15 U.S. metro areas by their percentage of million-dollar homes, from San Francisco to Miami.


We visualize global CO2 emissions by income group, showing the impact of different wealth brackets on carbon generation.


What are Gen Z's favorite brands? Here are the top 5 brands for apparel, footwear, and handbags, according to U.S. teens in September 2023.
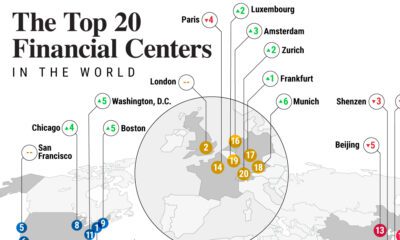

Where are the leading global financial centers in today's evolving economic landscape? Here are the top commerce hubs in 2023.
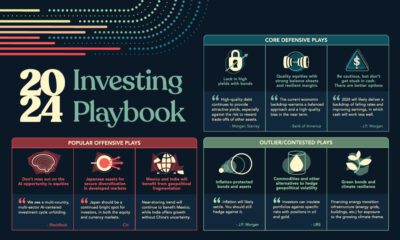

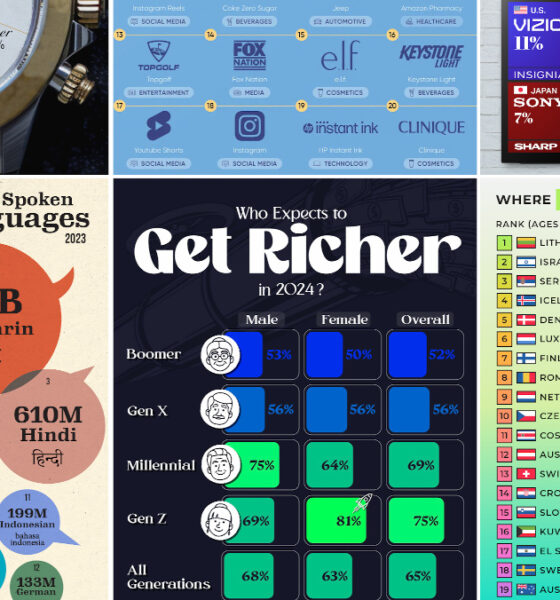
As top institutions advise for cautious deployment of capital next year, what assets and strategies are in their investing playbook in 2024?
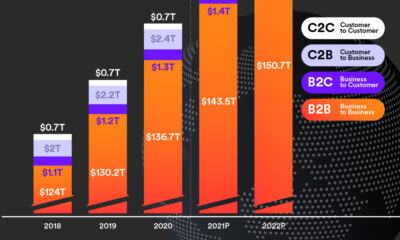

Cross-border payments grew to $150 trillion in 2022—nearly 30x the size of the global tech industry—and could hit $250 trillion by 2027.


Get Visual Capitalist's new app, Voronoi, and discover the world's most interesting data and stories, all on one trusted platform.
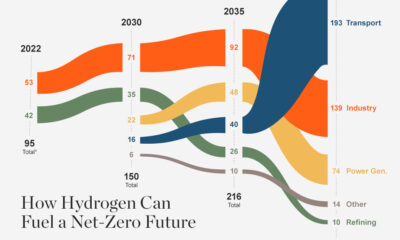

In the race to net zero, demand for hydrogen could increase to 430 Mt p.a. by 2050, but will supply be there when the world needs...
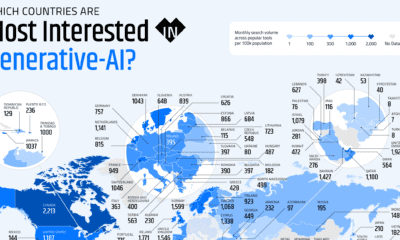

These graphics highlight interest in generative AI by country, covering interest in text, image, video, or audio generation.
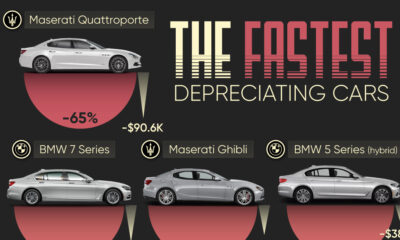

We visualize which cars depreciate the fastest based on the rate their value drops over five years. Spoiler: luxury cars don't do well.
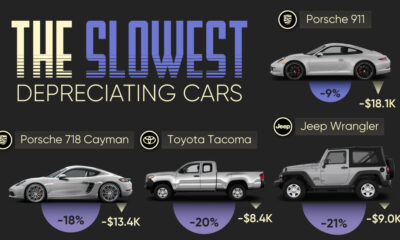

We visualize which cars have the best resale value based on the rate their value drops over five years. Spoiler: Porsche is King.
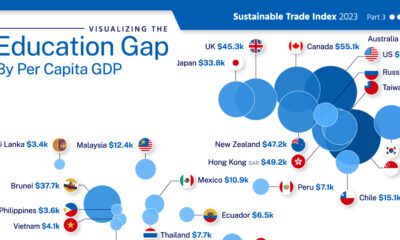

This graphic adds visual context to the global education gap, using data from 29 major economies.
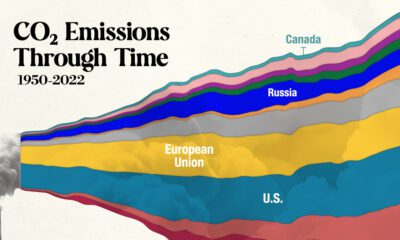

In this streamgraph, we break down global CO2 emissions between 1950 and 2022 using data from Berkeley Earth and Global Carbon Project.
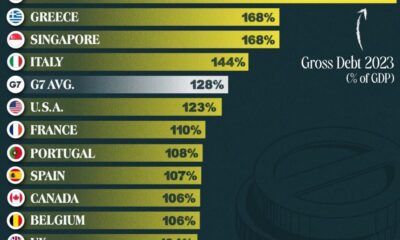

This graphic ranks government debt by country for advanced economies, using their gross debt-to-GDP ratio.


 Creator Program