Energy
Mapped: Which Ports are Receiving the Most Russian Fossil Fuel Shipments?
As the invasion of Ukraine wears on, European countries are scrambling to find alternatives to Russian fossil fuels.
In fact, an estimated 93% of Russian oil sales to the EU are due to be eliminated by the end of the year, and many countries have seen their imports of Russian gas plummet. Despite this, Russia earned €93 billion in revenue from fossil fuel exports in the first 100 days of the invasion.
While the bulk of fossil fuels travel through Europe via pipelines, there are still a number marine shipments moving between ports. The maps below, using data from MarineTraffic.com and Datalastic, compiled by the Centre for Research on Energy and Clean Air (CREA), are a look at Russia’s fossil fuel shipments during the first 100 days of the invasion.
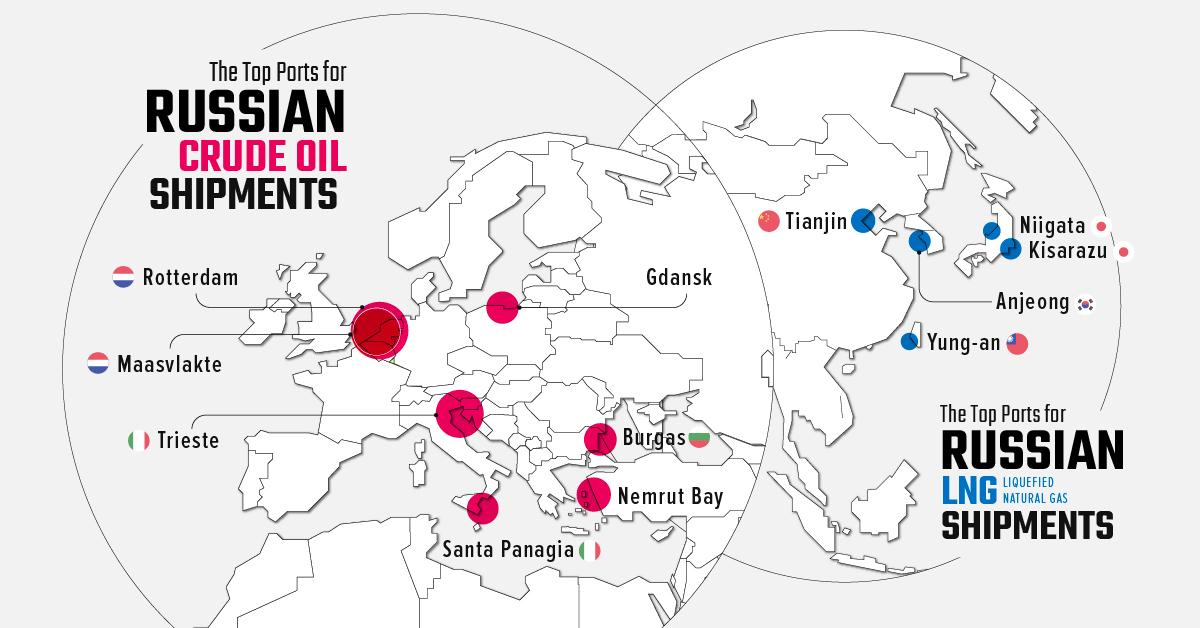
Russia’s Crude Oil Shipments
Much of Russia’s marine shipments of crude oil went to the Netherlands and Italy, but crude was also shipped as far away as India and South Korea.
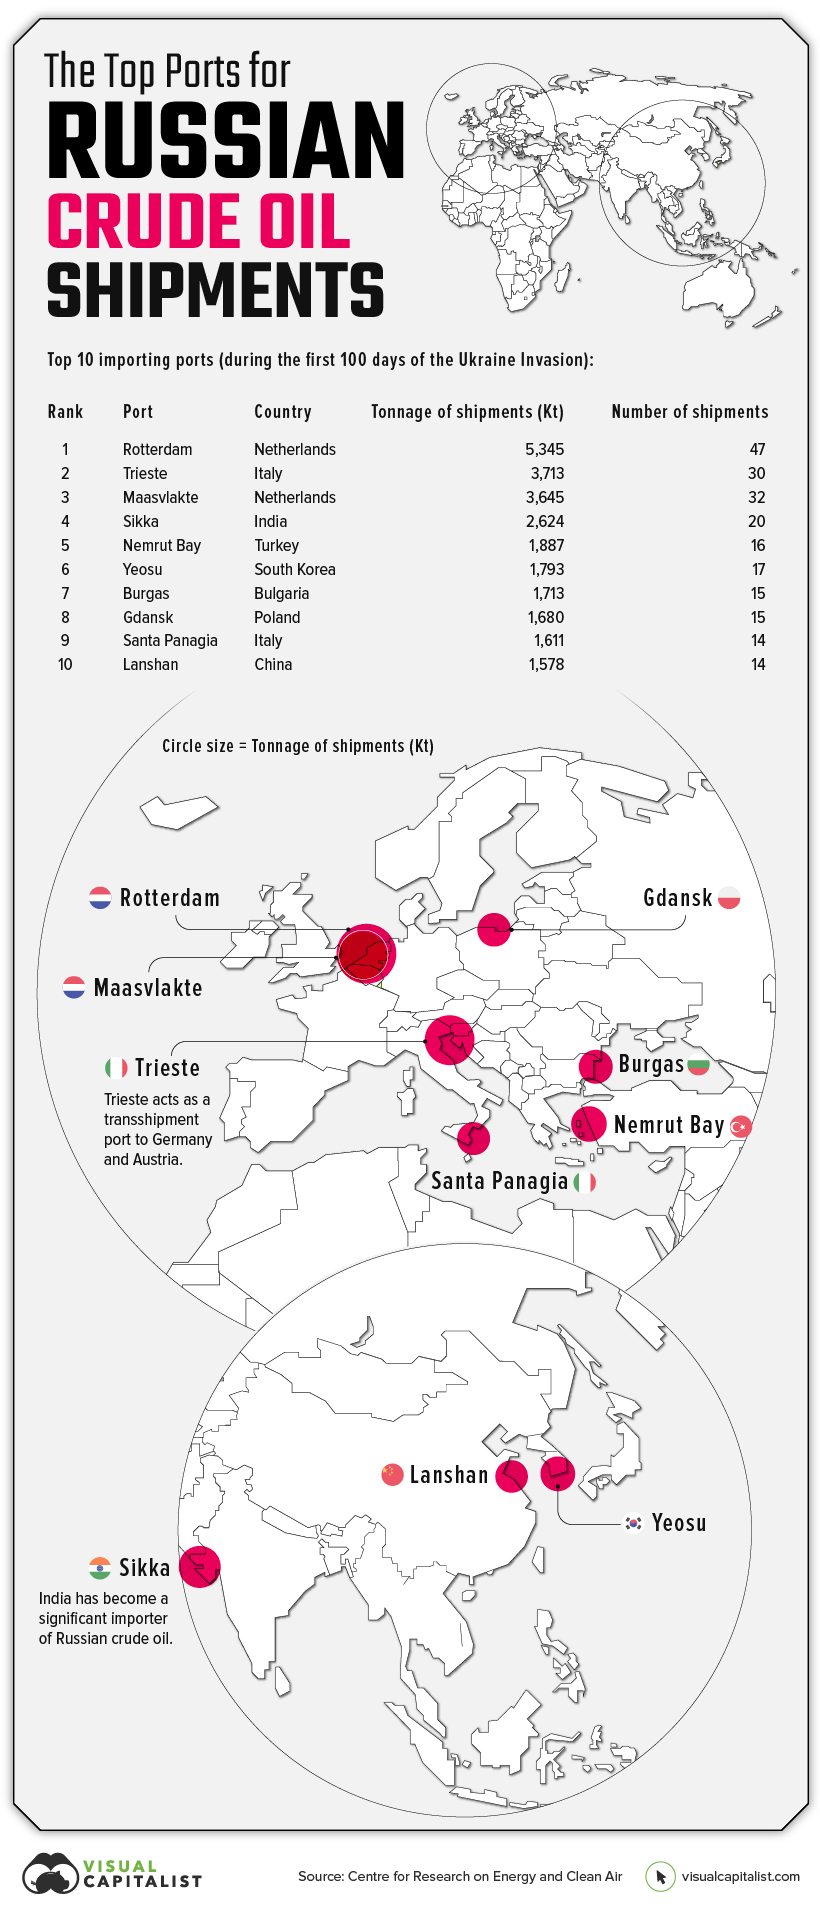
India became a significant importer of Russian crude oil, buying 18% of the country’s exports (up from just 1%). From a big picture perspective, India and China now account for about half of Russia’s marine-based oil exports.
It’s important to note that a broad mix of companies were involved in shipping this oil, with some of the companies tapering their trade activity with Russia over time. Even as shipments begin to shift away from Europe though, European tankers are still doing the majority of the shipping.
Russia’s Liquefied Natural Gas Shipments
Unlike the gas that flows along the many pipeline routes traversing Europe, liquefied natural gas (LNG) is cooled down to a liquid form for ease and safety of transport by sea. Below, we can see that shipments went to a variety of destinations in Europe and Asia.
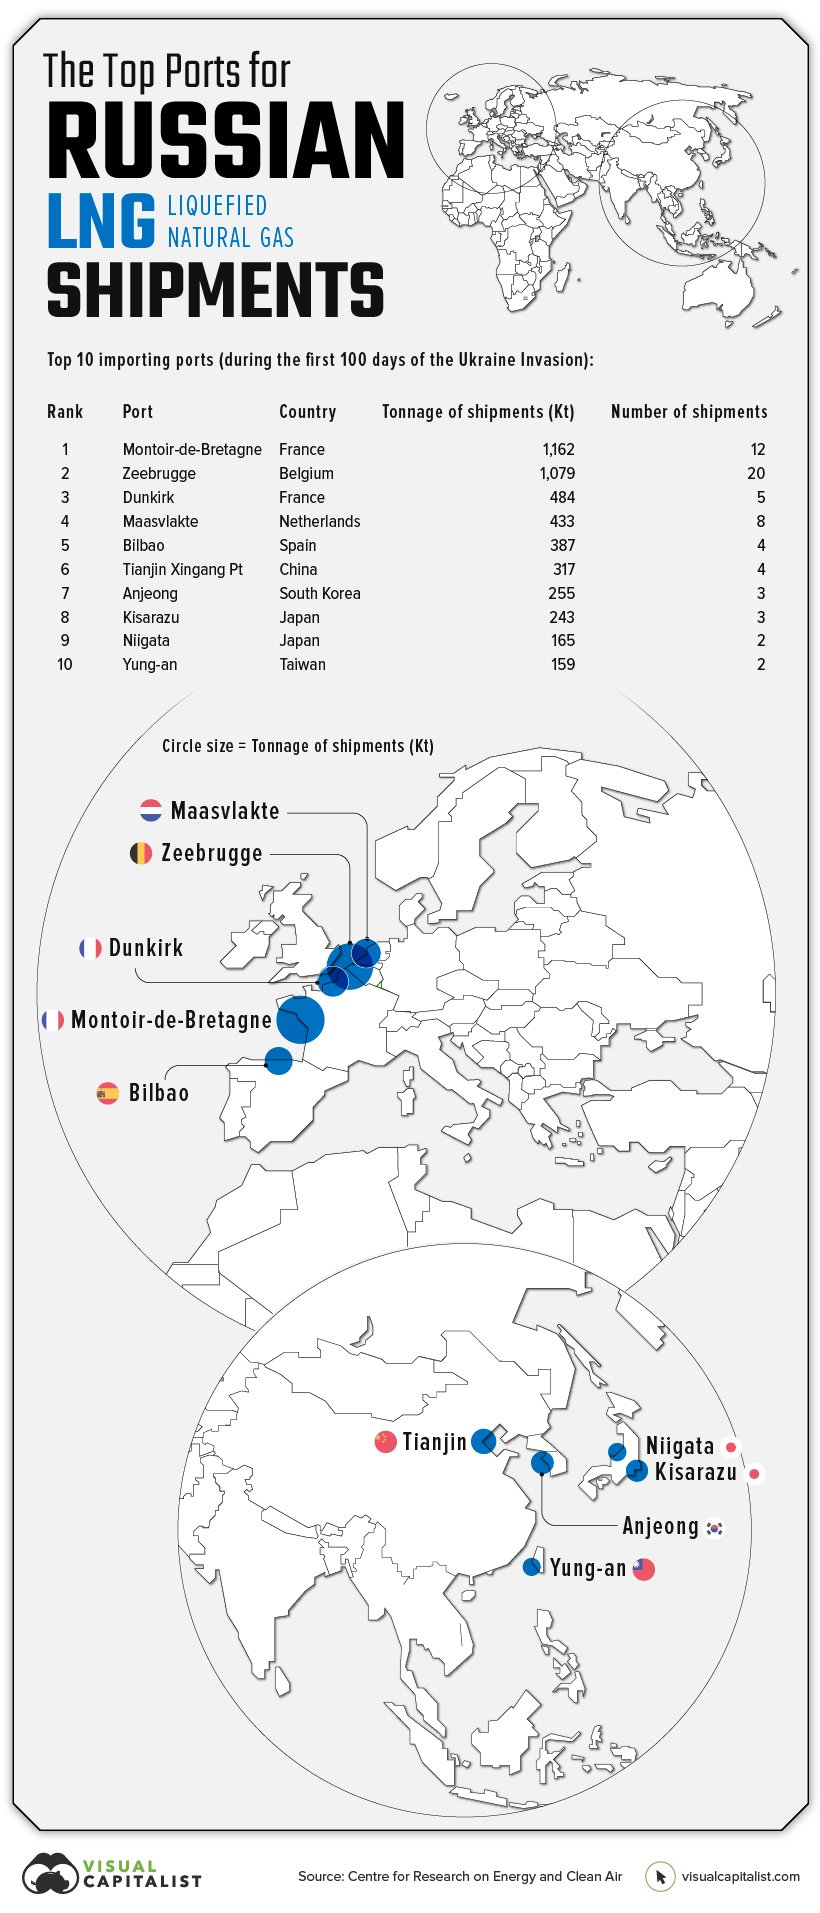
Fluxys terminals in France and Belgium stand out as the main destinations for Russian LNG deliveries.
Russia’s Oil Product Shipments
For crude oil tankers and LNG tankers, the type of cargo is known. For this dataset, CREA assumed that oil products tankers and oil/chemical tankers were carrying oil products.
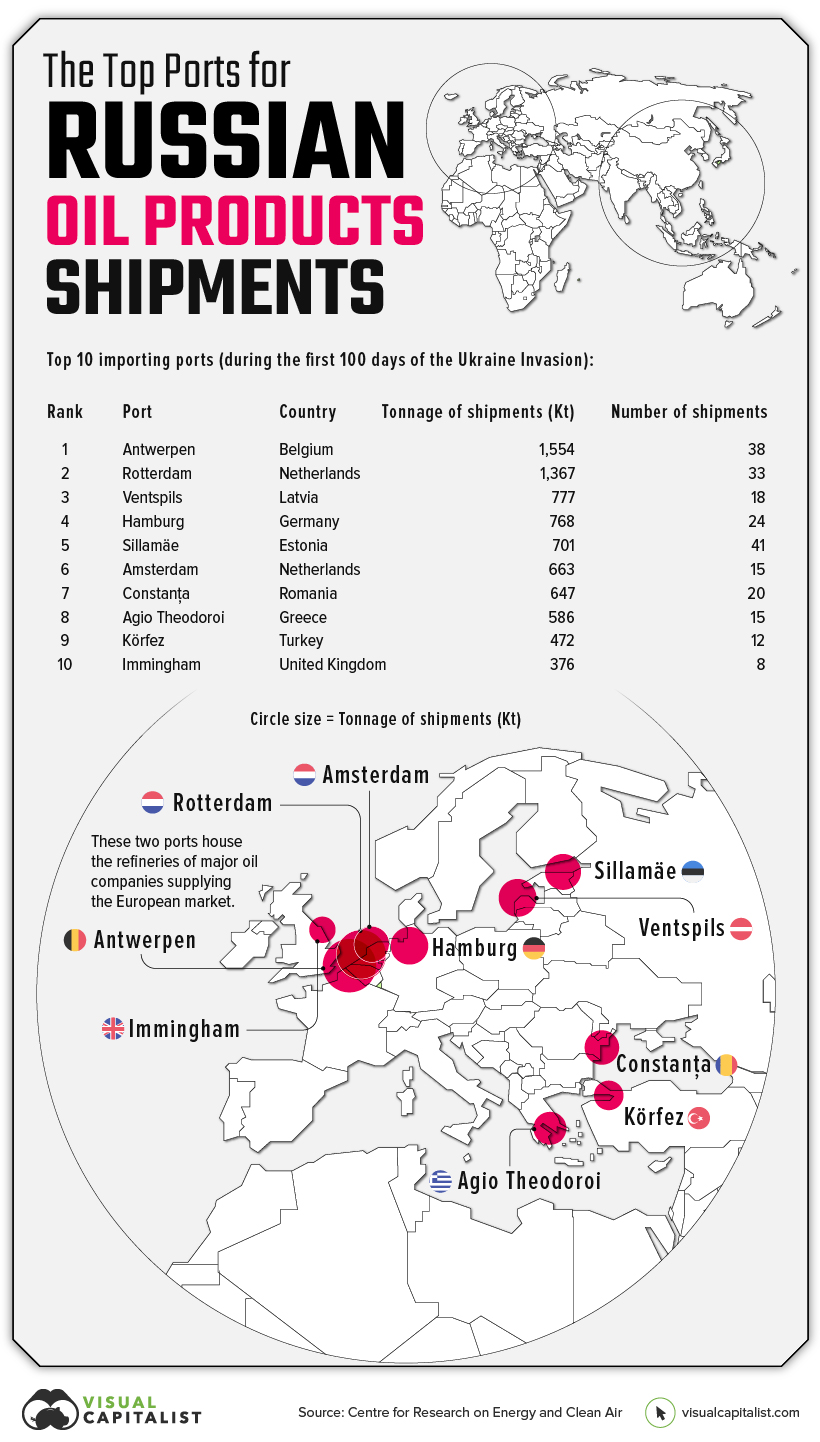
Huge ports in Rotterdam and Antwerp, which house major refineries, were the destination for many of these oil products. Some shipments also went to destinations around the Mediterranean as well.
All of the top ports in this category were located within the vicinity of Europe.
Russia’s Coal Shipments
Finally, we look at marine-based coal shipments from Russia. For this category, CREA identified 25 “coal export terminals” within Russian ports. These are specific port locations that are associated with loading coal, so when a vessel takes on cargo at one of these locations, it is assumed that the shipment is a coal shipment.
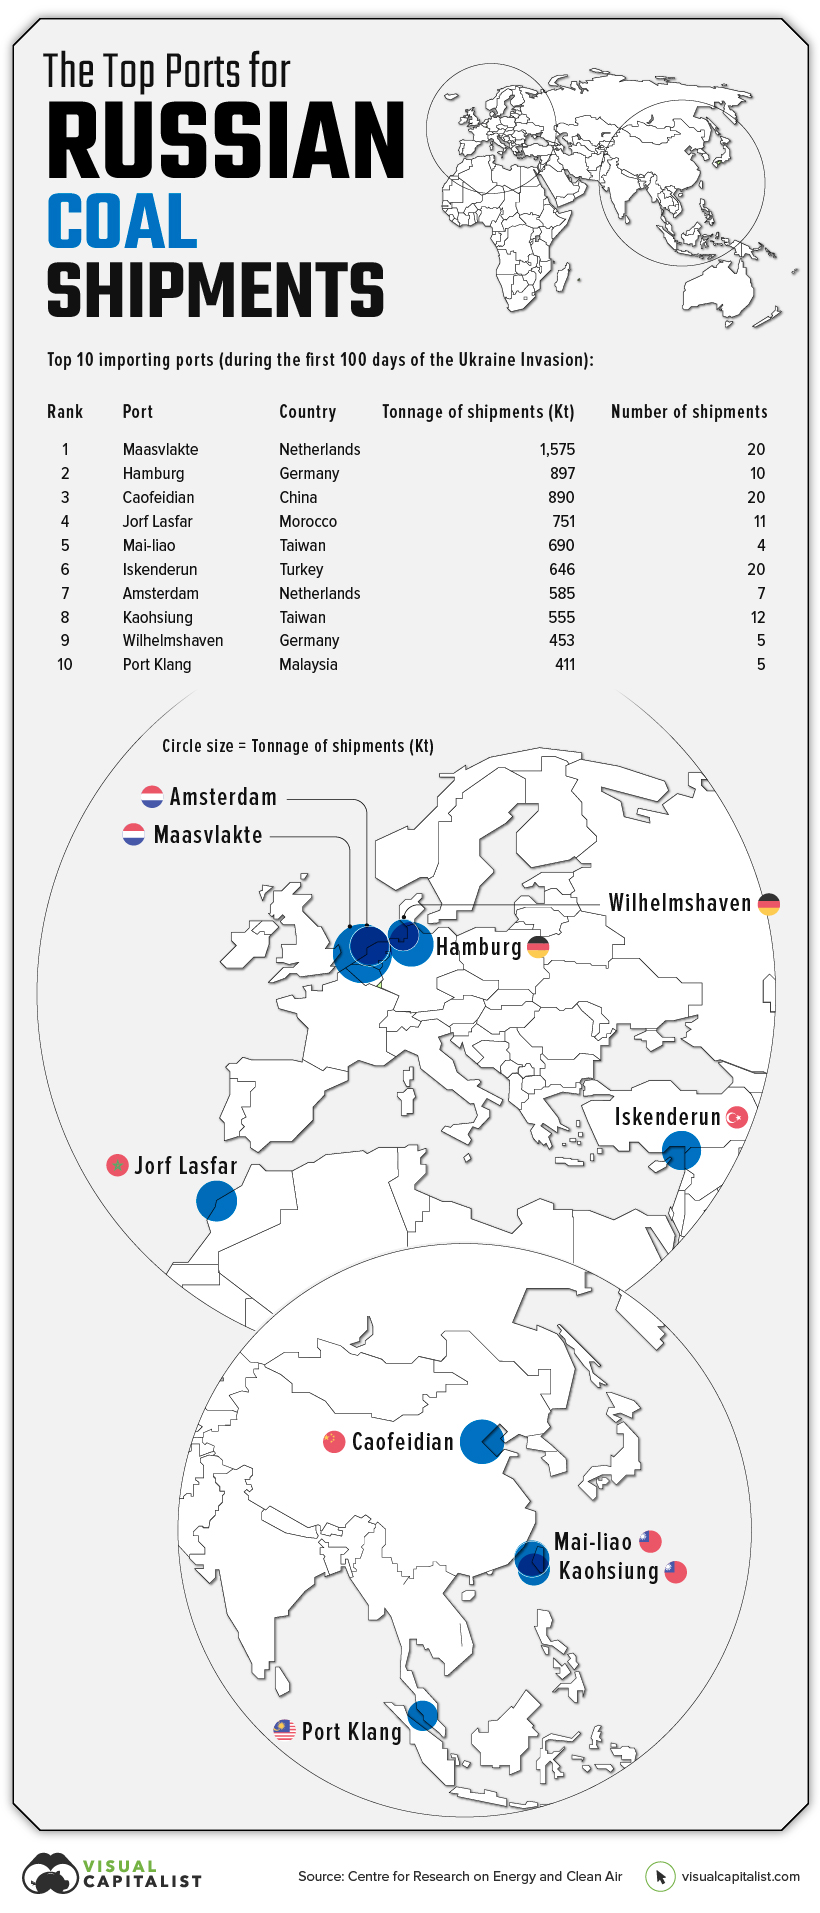
The European Union has proposed a Russian coal ban that is expected to take effect in August. While this may seem like a slow reaction, it’s one example of how the invasion of Ukraine is throwing large-scale, complex supply chains into disarray.
With such a heavy reliance on Russian fossil fuels, the EU will be have a busy year trying to secure substitute fuels – particularly if the conflict in Ukraine continues to drag on.


Energy
Charted: 4 Reasons Why Lithium Could Be the Next Gold Rush
Visual Capitalist has partnered with EnergyX to show why drops in prices and growing demand may make now the right time to invest in lithium.


4 Reasons Why You Should Invest in Lithium
Lithium’s importance in powering EVs makes it a linchpin of the clean energy transition and one of the world’s most precious minerals.
In this graphic, Visual Capitalist partnered with EnergyX to explore why now may be the time to invest in lithium.
1. Lithium Prices Have Dropped
One of the most critical aspects of evaluating an investment is ensuring that the asset’s value is higher than its price would indicate. Lithium is integral to powering EVs, and, prices have fallen fast over the last year:
| Date | LiOH·H₂O* | Li₂CO₃** |
|---|---|---|
| Feb 2023 | $76 | $71 |
| March 2023 | $71 | $61 |
| Apr 2023 | $43 | $33 |
| May 2023 | $43 | $33 |
| June 2023 | $47 | $45 |
| July 2023 | $44 | $40 |
| Aug 2023 | $35 | $35 |
| Sept 2023 | $28 | $27 |
| Oct 2023 | $24 | $23 |
| Nov 2023 | $21 | $21 |
| Dec 2023 | $17 | $16 |
| Jan 2024 | $14 | $15 |
| Feb 2024 | $13 | $14 |
Note: Monthly spot prices were taken as close to the 14th of each month as possible.
*Lithium hydroxide monohydrate MB-LI-0033
**Lithium carbonate MB-LI-0029
2. Lithium-Ion Battery Prices Are Also Falling
The drop in lithium prices is just one reason to invest in the metal. Increasing economies of scale, coupled with low commodity prices, have caused the cost of lithium-ion batteries to drop significantly as well.
In fact, BNEF reports that between 2013 and 2023, the price of a Li-ion battery dropped by 82%.
| Year | Price per KWh |
|---|---|
| 2023 | $139 |
| 2022 | $161 |
| 2021 | $150 |
| 2020 | $160 |
| 2019 | $183 |
| 2018 | $211 |
| 2017 | $258 |
| 2016 | $345 |
| 2015 | $448 |
| 2014 | $692 |
| 2013 | $780 |

3. EV Adoption is Sustainable
One of the best reasons to invest in lithium is that EVs, one of the main drivers behind the demand for lithium, have reached a price point similar to that of traditional vehicle.
According to the Kelly Blue Book, Tesla’s average transaction price dropped by 25% between 2022 and 2023, bringing it in line with many other major manufacturers and showing that EVs are a realistic transport option from a consumer price perspective.
| Manufacturer | September 2022 | September 2023 |
|---|---|---|
| BMW | $69,000 | $72,000 |
| Ford | $54,000 | $56,000 |
| Volkswagon | $54,000 | $56,000 |
| General Motors | $52,000 | $53,000 |
| Tesla | $68,000 | $51,000 |
4. Electricity Demand in Transport is Growing
As EVs become an accessible transport option, there’s an investment opportunity in lithium. But possibly the best reason to invest in lithium is that the IEA reports global demand for the electricity in transport could grow dramatically by 2030:
| Transport Type | 2022 | 2025 | 2030 |
|---|---|---|---|
| Buses 🚌 | 23,000 GWh | 50,000 GWh | 130,000 GWh |
| Cars 🚙 | 65,000 GWh | 200,000 GWh | 570,000 GWh |
| Trucks 🛻 | 4,000 GWh | 15,000 GWh | 94,000 GWh |
| Vans 🚐 | 6,000 GWh | 16,000 GWh | 72,000 GWh |
The Lithium Investment Opportunity
Lithium presents a potentially classic investment opportunity. Lithium and battery prices have dropped significantly, and recently, EVs have reached a price point similar to other vehicles. By 2030, the demand for clean energy, especially in transport, will grow dramatically.
With prices dropping and demand skyrocketing, now is the time to invest in lithium.
EnergyX is poised to exploit lithium demand with cutting-edge lithium extraction technology capable of extracting 300% more lithium than current processes.

-

 Lithium5 days ago
Ranked: The Top 10 EV Battery Manufacturers in 2023
Asia dominates this ranking of the world’s largest EV battery manufacturers in 2023.
-

 Energy1 week ago
The World’s Biggest Nuclear Energy Producers
China has grown its nuclear capacity over the last decade, now ranking second on the list of top nuclear energy producers.
-

 Energy1 month ago
The World’s Biggest Oil Producers in 2023
Just three countries accounted for 40% of global oil production last year.
-

 Energy1 month ago
How Much Does the U.S. Depend on Russian Uranium?
Currently, Russia is the largest foreign supplier of nuclear power fuel to the U.S.
-

 Uranium2 months ago
Charted: Global Uranium Reserves, by Country
We visualize the distribution of the world’s uranium reserves by country, with 3 countries accounting for more than half of total reserves.
-

 Energy3 months ago
Visualizing the Rise of the U.S. as Top Crude Oil Producer
Over the last decade, the United States has established itself as the world’s top producer of crude oil, surpassing Saudi Arabia and Russia.


-

 Science1 week ago
Visualizing the Average Lifespans of Mammals
-

 Markets2 weeks ago
The Top 10 States by Real GDP Growth in 2023
-

 Demographics2 weeks ago
The Smallest Gender Wage Gaps in OECD Countries
-

 United States2 weeks ago
Where U.S. Inflation Hit the Hardest in March 2024
-

 Green2 weeks ago
Top Countries By Forest Growth Since 2001
-

 United States2 weeks ago
Ranked: The Largest U.S. Corporations by Number of Employees
-

 Maps2 weeks ago
The Largest Earthquakes in the New York Area (1970-2024)
-

 Green2 weeks ago
Ranked: The Countries With the Most Air Pollution in 2023