Markets
3 Insights From the FED’s Latest Economic Snapshot
3 Insights From the Latest U.S. Economic Data
Each month, the Federal Reserve Bank of New York publishes monthly economic snapshots.
To make this report accessible to a wider audience, we’ve identified the three most important takeaways from the report and compiled them into one infographic.
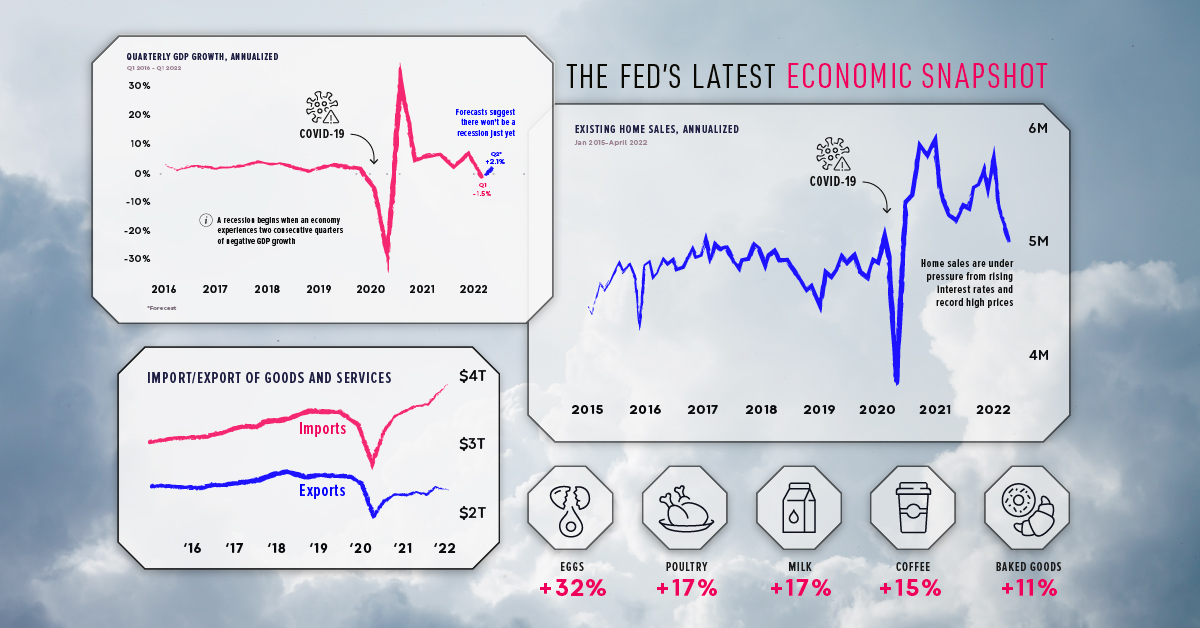
1. Growth figures in Q2 will make or break a recession
Generally speaking, a recession begins when an economy exhibits two consecutive quarters of negative GDP growth. Because U.S. GDP shrank by -1.5% in Q1 2022 (January to March), a lot rests on the Q2 figure (April to June) which should be released on July 28th.
Referencing strong business activity and continued growth in consumer spending, economists predict that U.S. GDP will grow by +2.1% in Q2. This would mark a decisive reversal from Q1, and put an end to recessionary fears for the time being.
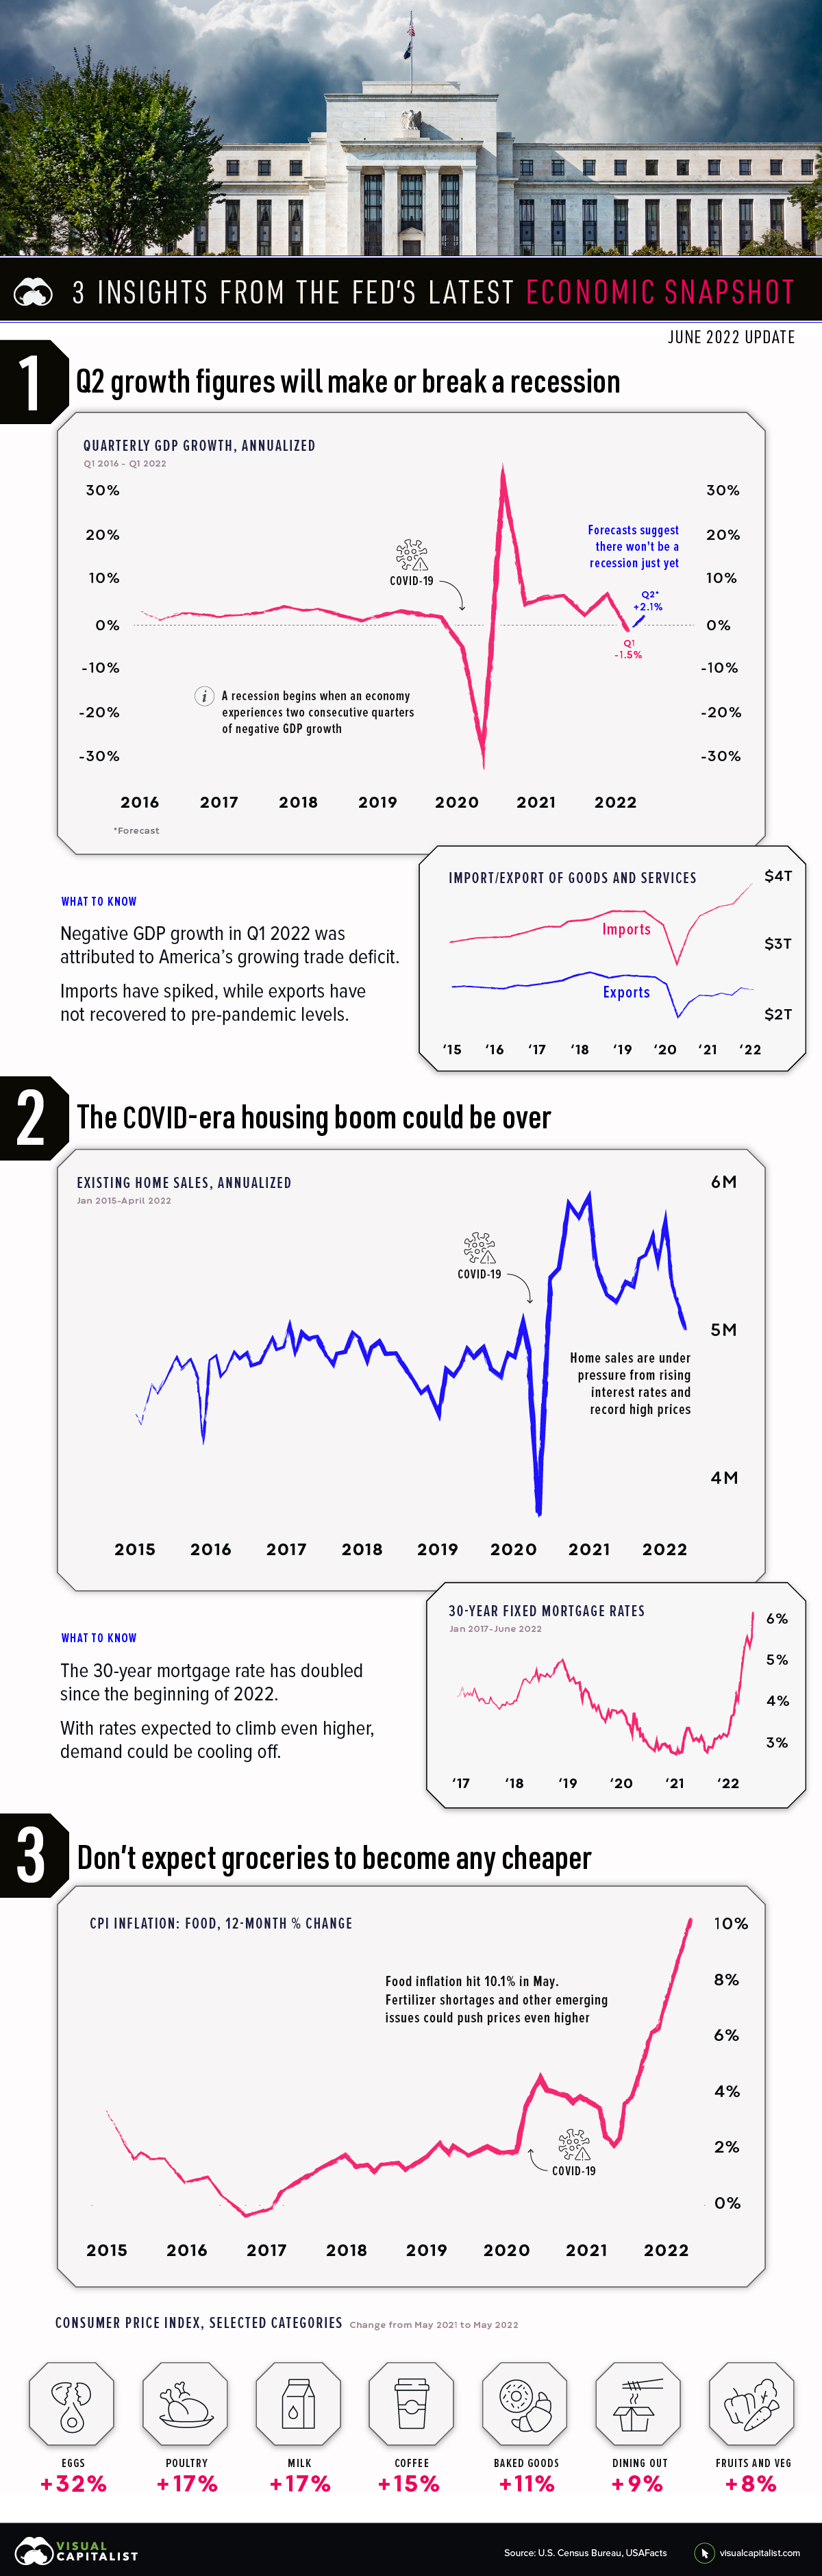
Unfortunately, inflation is the top financial concern for Americans, and this is dampening consumer confidence. Shown below, the consumer confidence index reflects the public’s short-term outlook for income, business, and labor conditions.
Falling consumer confidence suggests that more people will delay big purchases such as cars, major appliances, and vacations.
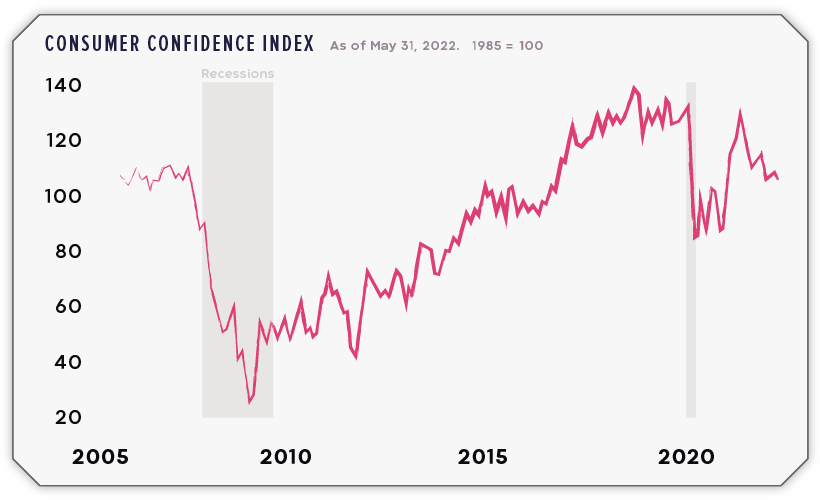
2. The COVID-era housing boom could be over
Housing markets have been riding high since the beginning of the COVID-19 pandemic, but this run is likely coming to an end. Here’s a summary of what’s happened since 2020:
- Lockdowns in early 2020 created lots of pent-up demand for homes
- Greater household savings and record-low mortgage rates pushed demand even further
- Supply chain disruptions greatly increased the cost of materials like lumber
- Construction of new homes couldn’t keep up, and housing supply fell to historic lows
Today, home prices are at record highs and the cost of borrowing is rapidly rising. For evidence, look no further than the 30-year fixed mortgage rate, which has doubled to more than 6% since the beginning of 2022.
Given these developments, the drop in the number of home sales could be a sign that many Americans are being priced out of the market.
3. Don’t expect groceries to become any cheaper
Inflation has been a hot topic this year, especially with gas prices reaching $5 a gallon. But there’s one category of goods that’s perhaps even more alarming: food.
The following table includes food inflation over the past three years, as the percent change over the past 12 months.
| Date | CPI Food Component (%) |
|---|---|
| 2018-02-01 | 1.4% |
| 2019-05-01 | 2.0% |
| 2019-06-01 | 1.9% |
| 2019-07-01 | 1.8% |
| 2019-08-01 | 1.7% |
| 2019-09-01 | 1.8% |
| 2019-10-01 | 2.1% |
| 2019-11-01 | 2.0% |
| 2019-12-01 | 1.8% |
| 2020-01-01 | 1.8% |
| 2020-02-01 | 1.8% |
| 2020-03-01 | 1.9% |
| 2020-04-01 | 3.5% |
| 2020-05-01 | 4.0% |
| 2020-06-01 | 4.5% |
| 2020-07-01 | 4.1% |
| 2020-08-01 | 4.1% |
| 2020-09-01 | 4.0% |
| 2020-10-01 | 3.9% |
| 2020-11-01 | 3.7% |
| 2020-12-01 | 3.9% |
| 2021-01-01 | 3.8% |
| 2021-02-01 | 3.6% |
| 2021-03-01 | 3.5% |
| 2021-04-01 | 2.4% |
| 2021-05-01 | 2.1% |
| 2021-06-01 | 2.4% |
| 2021-07-01 | 3.4% |
| 2021-08-01 | 3.7% |
| 2021-09-01 | 4.6% |
| 2021-10-01 | 5.3% |
| 2021-11-01 | 6.1% |
| 2021-12-01 | 6.3% |
| 2022-01-01 | 7.0% |
| 2022-02-01 | 7.9% |
| 2022-03-01 | 8.8% |
| 2022-04-01 | 9.4% |
| 2022-05-01 | 10.1% |
From this data, we can see that food inflation really picked up speed in April 2020, jumping to +3.5% from +1.9% in the previous month. This was due to supply chain disruptions and a sudden rebound in global demand.
Fast forward to today, and food inflation is running rampant at 10.1%. A contributing factor is the impending fertilizer shortage, which stems from the Ukraine war. As it turns out, Russia is not only a massive exporter of oil, but wheat and fertilizer as well.


Markets
The European Stock Market: Attractive Valuations Offer Opportunities
On average, the European stock market has valuations that are nearly 50% lower than U.S. valuations. But how can you access the market?


European Stock Market: Attractive Valuations Offer Opportunities
Europe is known for some established brands, from L’Oréal to Louis Vuitton. However, the European stock market offers additional opportunities that may be lesser known.
The above infographic, sponsored by STOXX, outlines why investors may want to consider European stocks.
Attractive Valuations
Compared to most North American and Asian markets, European stocks offer lower or comparable valuations.
| Index | Price-to-Earnings Ratio | Price-to-Book Ratio |
|---|---|---|
| EURO STOXX 50 | 14.9 | 2.2 |
| STOXX Europe 600 | 14.4 | 2 |
| U.S. | 25.9 | 4.7 |
| Canada | 16.1 | 1.8 |
| Japan | 15.4 | 1.6 |
| Asia Pacific ex. China | 17.1 | 1.8 |
Data as of February 29, 2024. See graphic for full index names. Ratios based on trailing 12 month financials. The price to earnings ratio excludes companies with negative earnings.
On average, European valuations are nearly 50% lower than U.S. valuations, potentially offering an affordable entry point for investors.
Research also shows that lower price ratios have historically led to higher long-term returns.
Market Movements Not Closely Connected
Over the last decade, the European stock market had low-to-moderate correlation with North American and Asian equities.
The below chart shows correlations from February 2014 to February 2024. A value closer to zero indicates low correlation, while a value of one would indicate that two regions are moving in perfect unison.
| EURO STOXX 50 | STOXX EUROPE 600 | U.S. | Canada | Japan | Asia Pacific ex. China |
|
|---|---|---|---|---|---|---|
| EURO STOXX 50 | 1.00 | 0.97 | 0.55 | 0.67 | 0.24 | 0.43 |
| STOXX EUROPE 600 | 1.00 | 0.56 | 0.71 | 0.28 | 0.48 | |
| U.S. | 1.00 | 0.73 | 0.12 | 0.25 | ||
| Canada | 1.00 | 0.22 | 0.40 | |||
| Japan | 1.00 | 0.88 | ||||
| Asia Pacific ex. China | 1.00 |
Data is based on daily USD returns.
European equities had relatively independent market movements from North American and Asian markets. One contributing factor could be the differing sector weights in each market. For instance, technology makes up a quarter of the U.S. market, but health care and industrials dominate the broader European market.
Ultimately, European equities can enhance portfolio diversification and have the potential to mitigate risk for investors.
Tracking the Market
For investors interested in European equities, STOXX offers a variety of flagship indices:
| Index | Description | Market Cap |
|---|---|---|
| STOXX Europe 600 | Pan-regional, broad market | €10.5T |
| STOXX Developed Europe | Pan-regional, broad-market | €9.9T |
| STOXX Europe 600 ESG-X | Pan-regional, broad market, sustainability focus | €9.7T |
| STOXX Europe 50 | Pan-regional, blue-chip | €5.1T |
| EURO STOXX 50 | Eurozone, blue-chip | €3.5T |
Data is as of February 29, 2024. Market cap is free float, which represents the shares that are readily available for public trading on stock exchanges.
The EURO STOXX 50 tracks the Eurozone’s biggest and most traded companies. It also underlies one of the world’s largest ranges of ETFs and mutual funds. As of November 2023, there were €27.3 billion in ETFs and €23.5B in mutual fund assets under management tracking the index.
“For the past 25 years, the EURO STOXX 50 has served as an accurate, reliable and tradable representation of the Eurozone equity market.”
— Axel Lomholt, General Manager at STOXX
Partnering with STOXX to Track the European Stock Market
Are you interested in European equities? STOXX can be a valuable partner:
- Comprehensive, liquid and investable ecosystem
- European heritage, global reach
- Highly sophisticated customization capabilities
- Open architecture approach to using data
- Close partnerships with clients
- Part of ISS STOXX and Deutsche Börse Group
With a full suite of indices, STOXX can help you benchmark against the European stock market.
Learn how STOXX’s European indices offer liquid and effective market access.

-

 Economy3 days ago
Economic Growth Forecasts for G7 and BRICS Countries in 2024
The IMF has released its economic growth forecasts for 2024. How do the G7 and BRICS countries compare?
-

 Markets2 weeks ago
U.S. Debt Interest Payments Reach $1 Trillion
U.S. debt interest payments have surged past the $1 trillion dollar mark, amid high interest rates and an ever-expanding debt burden.
-

 United States2 weeks ago
Ranked: The Largest U.S. Corporations by Number of Employees
We visualized the top U.S. companies by employees, revealing the massive scale of retailers like Walmart, Target, and Home Depot.
-

 Markets2 weeks ago
The Top 10 States by Real GDP Growth in 2023
This graphic shows the states with the highest real GDP growth rate in 2023, largely propelled by the oil and gas boom.
-

 Markets3 weeks ago
Ranked: The World’s Top Flight Routes, by Revenue
In this graphic, we show the highest earning flight routes globally as air travel continued to rebound in 2023.
-

 Markets3 weeks ago
Ranked: The Most Valuable Housing Markets in America
The U.S. residential real estate market is worth a staggering $47.5 trillion. Here are the most valuable housing markets in the country.


-

 Debt1 week ago
How Debt-to-GDP Ratios Have Changed Since 2000
-

 Countries2 weeks ago
Population Projections: The World’s 6 Largest Countries in 2075
-
Markets2 weeks ago
The Top 10 States by Real GDP Growth in 2023
-

 Demographics2 weeks ago
The Smallest Gender Wage Gaps in OECD Countries
-

 United States2 weeks ago
Where U.S. Inflation Hit the Hardest in March 2024
-

 Green2 weeks ago
Top Countries By Forest Growth Since 2001
-
United States2 weeks ago
Ranked: The Largest U.S. Corporations by Number of Employees
-

 Maps2 weeks ago
The Largest Earthquakes in the New York Area (1970-2024)