

Older, better-educated adults are winning the savings game, reveals a January survey by the National Opinion Research Center at the University of Chicago.


Inflation has impacted various car ownership costs in America, including prices for new and used cars, parts, and insurance.
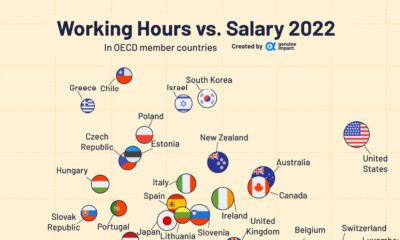

What are the average work hours and salaries in OECD countries? We look at the data for trends across regions.

Over 700,000 Californians moved from the Golden State to other parts of U.S. between 2020–21. But where did they go?
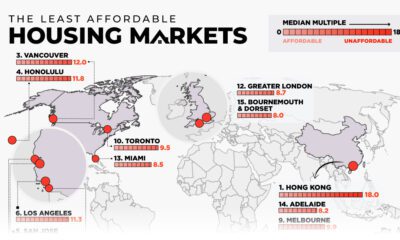

This map examines middle-income housing market affordability across eight major countries, highlighting some of the least affordable cities.
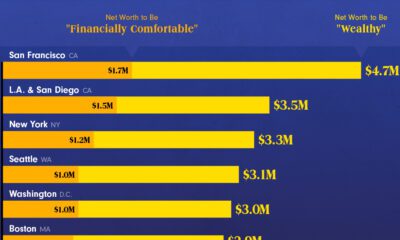

This graphic shows what it takes to be wealthy in America today—and how this can significantly shift based on the city you live in.
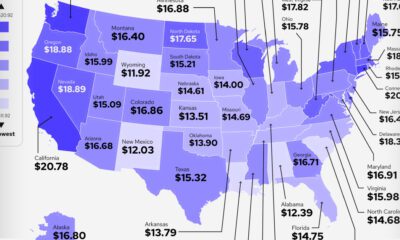

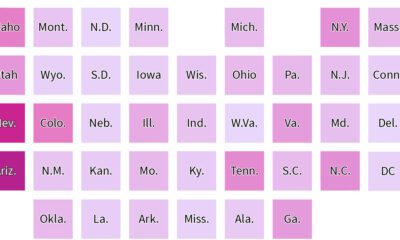
Which states and industries in the U.S. pay a good internship salary? Which pay the worst, or none at all?


From New York to Damascus, this infographic uses EIU cost of living data to rank the world's most and least expensive cities to live in
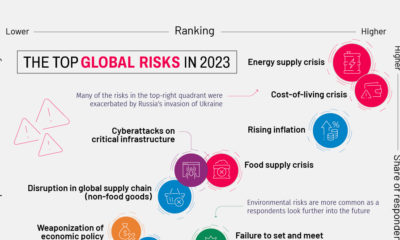

This year's Global Risks Report highlights ongoing economic issues, such as inflation, as well as existential threats like biological weapons
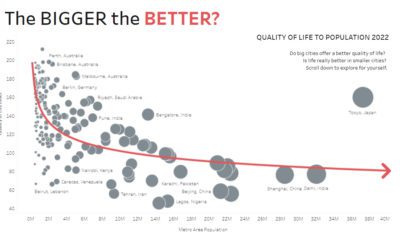

Are big cities all they’re cracked up to be? These interactive charts about population size question whether bigger always equals better.


 Creator Program