Misc
Mapped: Countries by Alcohol Consumption Per Capita

var divElement = document.getElementById(‘viz1710540551170’); var vizElement = divElement.getElementsByTagName(‘object’)[0]; vizElement.style.width=’1200px’;vizElement.style.height=’2094px’; var scriptElement = document.createElement(‘script’); scriptElement.src = ‘https://public.tableau.com/javascripts/api/viz_v1.js’; vizElement.parentNode.insertBefore(scriptElement, vizElement);
Mapped: Countries by Alcohol Consumption Per Capita
Alcohol might be one of the oldest and most frequently used recreational substances in the world, but examining countries by alcohol consumption shows that usage is not equal.
Consumption levels, and types of alcohol consumed, vary widely based on location. Furthermore, the availability of fruits and grains used in alcohol production impacts which drinks are more commonly consumed, as does the predominant culture. Some cultures see alcohol consumption as a pleasurable experience, while others see intoxication as a sin.
There’s also the question of economics and availability. It’s strange, but in some regions of the world, industrially mass-produced alcohol can flood markets and become cheaper than other beverages, including water.
When we map alcohol consumption by capita, and by different types of alcohol, these local and cultural stories come to light. The above maps use recorded consumption data from WHO for 2019, in liters of pure alcohol.
Europe Leads in Per Capita Alcohol Consumption
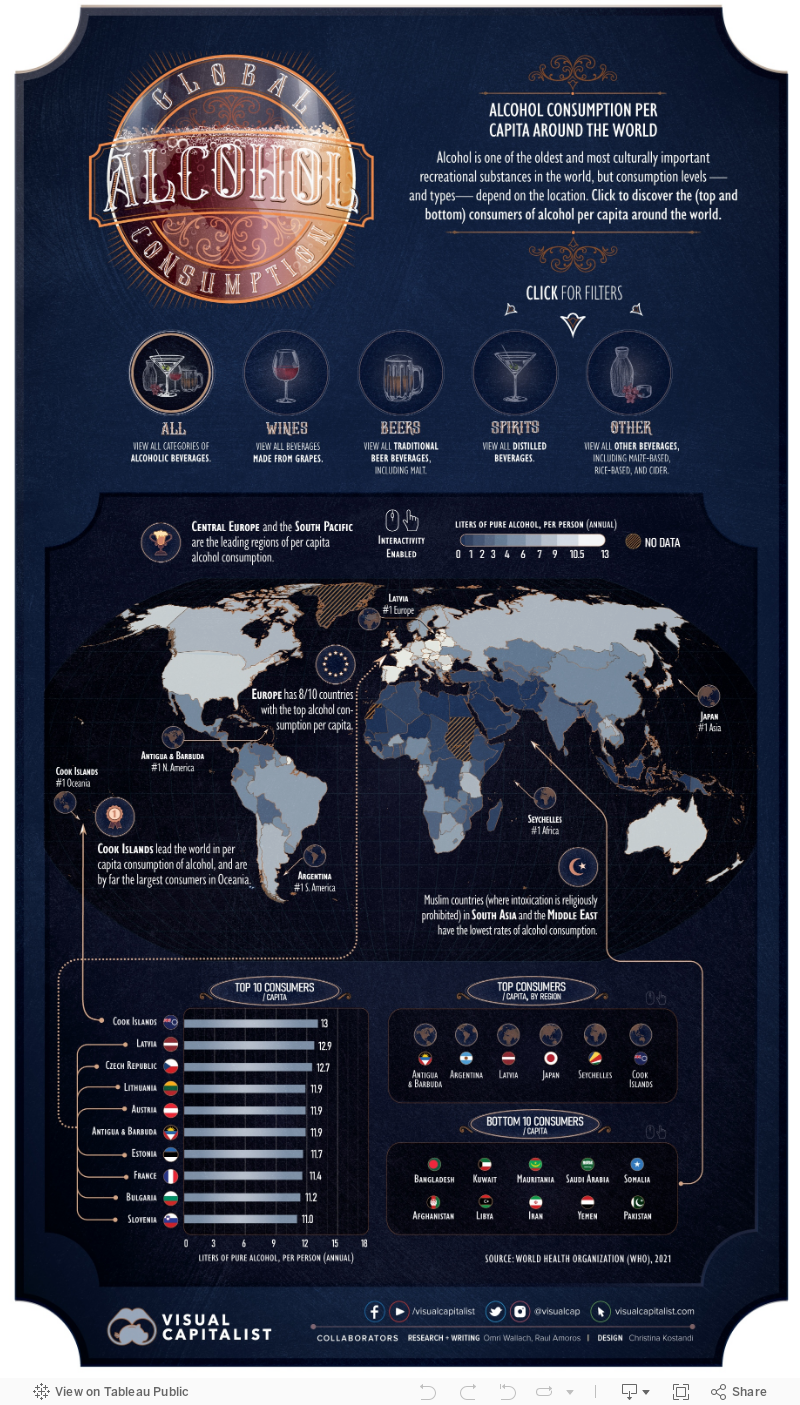
The top 10 countries by alcohol consumption highlight the prominence of alcoholic beverages in European culture.
Eight of the 10 countries with the top alcohol consumption per capita were in Europe. Primarily, they were Eastern and Central European countries, including #2 Latvia, #3 Czech Republic, #4 Lithuania, and #5 Austria.
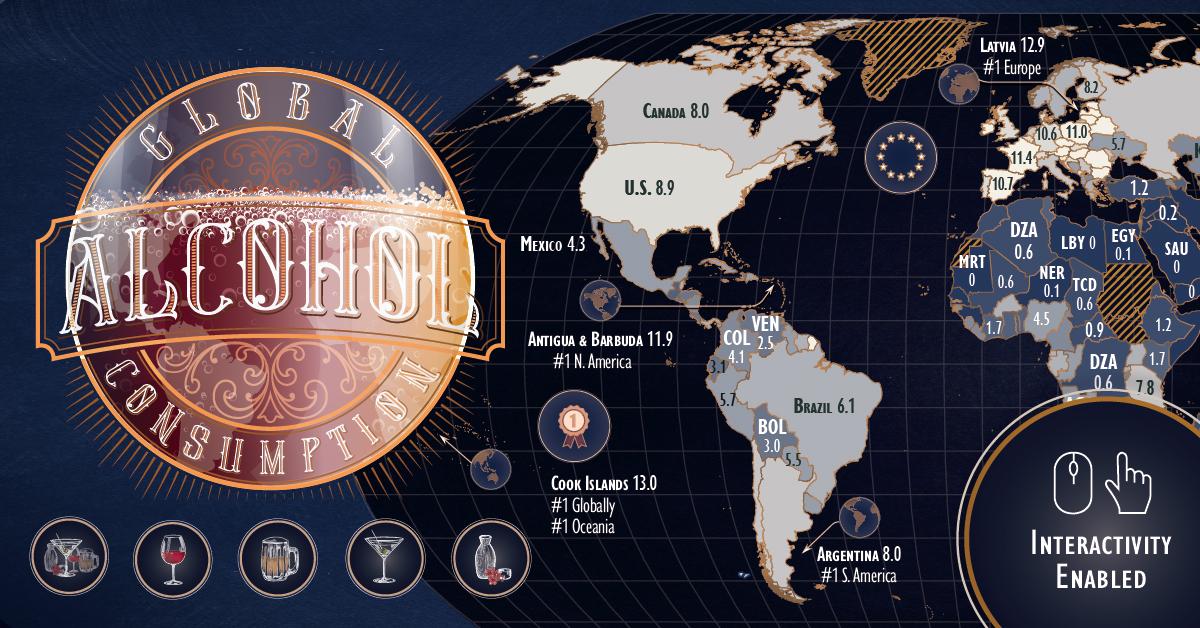
But the crown of alcohol consumption per capita goes to the Cook Islands, which leads the world with an annual per capita consumption of 13L (3.4 gallons) of alcohol.
| Location | 2019 Alcohol consumption/capita (L) |
|---|---|
| Cook Islands | 12.97 |
| Latvia | 12.90 |
| Czech Republic | 12.73 |
| Lithuania | 11.93 |
| Austria | 11.90 |
| Antigua and Barbuda | 11.88 |
| Estonia | 11.65 |
| France | 11.44 |
| Bulgaria | 11.18 |
| Slovenia | 11.05 |
| Luxembourg | 11.00 |
| Andorra | 10.99 |
| Romania | 10.96 |
| Poland | 10.96 |
| Ireland | 10.91 |
| Hungary | 10.79 |
| Spain | 10.72 |
| Belarus | 10.57 |
| Germany | 10.56 |
| Portugal | 10.37 |
| Slovakia | 10.30 |
| Barbados | 9.94 |
| Montenegro | 9.91 |
| UK | 9.80 |
| Cyprus | 9.64 |
| Croatia | 9.64 |
| Australia | 9.51 |
| Seychelles | 9.48 |
| Bahamas | 9.48 |
| Switzerland | 9.41 |
| Saint Lucia | 9.30 |
| New Zealand | 9.17 |
| Denmark | 9.16 |
| Belgium | 9.15 |
| U.S. | 8.93 |
| Saint Kitts and Nevis | 8.84 |
| Grenada | 8.62 |
| Niue | 8.50 |
| Japan | 8.36 |
| Netherlands | 8.23 |
| Finland | 8.23 |
| Lao People's Democratic Republic | 8.15 |
| Malta | 8.07 |
| Canada | 8.00 |
| Argentina | 7.95 |
| United Republic of Tanzania | 7.81 |
| Chile | 7.80 |
| South Korea | 7.74 |
| Iceland | 7.72 |
| Eswatini | 7.68 |
| Italy | 7.65 |
| Saint Vincent and the Grenadines | 7.48 |
| Serbia | 7.45 |
| Republic of Moldova | 7.45 |
| Georgia | 7.45 |
| Russian Federation | 7.29 |
| Burkina Faso | 7.28 |
| South Africa | 7.21 |
| Sweden | 7.10 |
| Thailand | 6.86 |
| Uganda | 6.82 |
| Suriname | 6.60 |
| Panama | 6.54 |
| Gabon | 6.47 |
| Rwanda | 6.35 |
| Greece | 6.33 |
| Dominica | 6.32 |
| Brazil | 6.12 |
| Equatorial Guinea | 6.11 |
| Norway | 6.05 |
| Botswana | 5.98 |
| Belize | 5.93 |
| Angola | 5.84 |
| Trinidad and Tobago | 5.81 |
| Peru | 5.74 |
| Congo | 5.74 |
| Ukraine | 5.69 |
| Dominican Republic | 5.56 |
| Paraguay | 5.47 |
| Mongolia | 5.46 |
| Bosnia and Herzegovina | 5.46 |
| Uruguay | 5.42 |
| Guyana | 5.11 |
| Philippines | 4.85 |
| Cuba | 4.70 |
| Cabo Verde | 4.70 |
| Cambodia | 4.56 |
| Nigeria | 4.49 |
| China | 4.48 |
| Albania | 4.40 |
| Mexico | 4.25 |
| Sao Tome and Principe | 4.23 |
| Colombia | 4.09 |
| Cameroon | 4.09 |
| Burundi | 4.07 |
| Kyrgyzstan | 4.02 |
| Macedonia | 3.90 |
| Zambia | 3.82 |
| Armenia | 3.77 |
| Kazakhstan | 3.73 |
| Nicaragua | 3.69 |
| North Korea | 3.61 |
| Lesotho | 3.56 |
| Jamaica | 3.46 |
| Viet Nam | 3.41 |
| Mauritius | 3.39 |
| Sierra Leone | 3.22 |
| Guinea-Bissau | 3.21 |
| Liberia | 3.12 |
| Zimbabwe | 3.11 |
| India | 3.09 |
| Israel | 3.07 |
| Costa Rica | 3.07 |
| Ecuador | 3.05 |
| Bolivia | 2.98 |
| El Salvador | 2.94 |
| Turkmenistan | 2.88 |
| Haiti | 2.85 |
| Honduras | 2.73 |
| Fiji | 2.71 |
| Gambia | 2.67 |
| Sri Lanka | 2.58 |
| Venezuela | 2.51 |
| Uzbekistan | 2.45 |
| Nauru | 2.44 |
| Namibia | 2.38 |
| Samoa | 2.18 |
| Myanmar | 2.06 |
| Malawi | 2.04 |
| United Arab Emirates | 2.03 |
| Singapore | 1.81 |
| Côte d’Ivoire | 1.70 |
| Kenya | 1.68 |
| Guatemala | 1.63 |
| Vanuatu | 1.60 |
| Micronesia | 1.59 |
| Ghana | 1.59 |
| Tunisia | 1.51 |
| Mozambique | 1.46 |
| Togo | 1.40 |
| Maldives | 1.38 |
| Azerbaijan | 1.38 |
| Papua New Guinea | 1.26 |
| Benin | 1.25 |
| Solomon Islands | 1.19 |
| Turkey | 1.18 |
| Bahrain | 1.18 |
| Ethiopia | 1.16 |
| Lebanon | 1.14 |
| Qatar | 0.96 |
| Central African Republic | 0.94 |
| Tuvalu | 0.93 |
| Eritrea | 0.93 |
| Madagascar | 0.89 |
| Tajikistan | 0.85 |
| Brunei Darussalam | 0.69 |
| Malaysia | 0.64 |
| Mali | 0.60 |
| Algeria | 0.59 |
| Democratic Republic of the Congo | 0.56 |
| Chad | 0.55 |
| Morocco | 0.51 |
| Oman | 0.47 |
| Kiribati | 0.43 |
| Timor-Leste | 0.41 |
| Nepal | 0.36 |
| Guinea | 0.33 |
| Tonga | 0.31 |
| Senegal | 0.25 |
| Jordan | 0.25 |
| Djibouti | 0.21 |
| Comoros | 0.18 |
| Iraq | 0.16 |
| Egypt | 0.14 |
| Syrian Arab Republic | 0.13 |
| Niger | 0.11 |
| Indonesia | 0.08 |
| Bhutan | 0.07 |
| Pakistan | 0.04 |
| Yemen | 0.02 |
| Iran | 0.02 |
| Libya | 0.01 |
| Afghanistan | 0.01 |
| Somalia | 0 |
| Saudi Arabia | 0 |
| Mauritania | 0 |
| Kuwait | 0 |
| Bangladesh | 0 |
At the bottom of the consumption charts? Not surprisingly, it’s Bangladesh, Saudi Arabia, Kuwait, and other Muslim countries where intoxication is religiously prohibited.
Regional Disparities in Alcohol Consumption
Per capita consumption of alcohol also highlights clear regional preferences in amount and type, or a lack of interest.
The biggest consumers of alcohol are countries in Central Europe, the South Pacific, and parts of the Caribbean. In Europe, beer and wine are kings, with most of the top consumers also being top producers such as France and Germany.
Spirits like rum, meanwhile, are dominant in the Cook Islands and much of the Caribbean, which has four of the 12 top spirit consumers. The others are mainly in Eastern Europe and Russia, which get most of their alcohol consumption from vodka.
| Top Consuming Country by Alcohol | Type | Consumption/Capita |
|---|---|---|
| Czech Republic | Beer | 6.77L |
| France | Wine | 6.44L |
| Cook Islands | Spirits | 7.07L |
| Tanzania | Others | 6.60L |
The importance of local crops couldn’t be overstated. Regions like Africa and Asia that struggle with the right conditions for grapes or hops saw higher consumption of “other” distilled drinks.
These include rice alcohol in South Korea and Japan, and drinks made from sugarcane, molasses, and even bananas in African countries like Tanzania.
Unlike goods like coffee or tea, alcohol can be produced from many different grains, fruits, or sources of sugar that can be fermented—so it’s natural that regional differences in types, amounts, and even cultural importance would arise.
But as one of the world’s most widely used recreational drugs, it’s played a storied role throughout history that is certain to continue evolving.


Misc
Visualizing the Most Common Pets in the U.S.
Lions, tigers, and bears, oh my!—these animals do not feature on this list of popular American household pets.


Visualizing The Most Common Pets in the U.S.
This was originally posted on our Voronoi app. Download the app for free on iOS or Android and discover incredible data-driven charts from a variety of trusted sources.
In this graphic, we visualized the most common American household pets, based on 2023-2024 data from the American Pet Products Association (accessed via Forbes Advisor).
Figures represent the number of households that own each pet type, rather than the actual number of each animal. The “small animal” category includes hamsters, gerbils, rabbits, guinea pigs, chinchillas, mice, rats, and ferrets.
What is the Most Popular American Household Pet?
Based on this data, dogs—one of the first domesticated animals—are the most common pets in the United States. In fact, around 65 million households own a dog, and spend an average of $900 a year on their care.
| Rank | Species | Households |
|---|---|---|
| 1 | 🐶 Dog | 65M |
| 2 | 🐱 Cat | 47M |
| 3 | 🐟 Freshwater Fish | 11M |
| 4 | 🐰 Small Animals | 7M |
| 5 | 🐦 Bird | 6M |
| 6 | 🦎 Reptile | 6M |
| 7 | 🐴 Horse | 2M |
| 8 | 🐠 Saltwater Fish | 2M |
Note: Households can own multiple pets, and are counted for all relevant categories.
Cats rank second, at 47 million households, and these smaller felines are a little less expensive to own at $700/year according to Forbes estimates.
But aside from these two juggernauts, there are plenty of other common pet types found in households across the country.
Freshwater fish can be found in 11 million households, along with small animals—rabbits, hamsters, guinea pigs—in 7 million. Meanwhile, nearly 6 million homes have birds or reptiles.
Pet Ownership is on the Rise in America
Forbes found that 66% of all American households (numbering 87 million) own at least one pet, up from 56% in 1988. One third of these (29 million) own multiple pets.
A combination of factors is driving this increase: rising incomes, delayed childbirth, and of course the impact of the pandemic which nearly cleared out animal shelters across the globe.
America’s loneliness epidemic may also be a factor. Fledgling research has shown that single-individual households with pets recorded lower rates of loneliness during the pandemic than those without a pet.

-

 Science1 week ago
Visualizing the Average Lifespans of Mammals
-

 Markets2 weeks ago
The Top 10 States by Real GDP Growth in 2023
-

 Demographics2 weeks ago
The Smallest Gender Wage Gaps in OECD Countries
-

 United States2 weeks ago
Where U.S. Inflation Hit the Hardest in March 2024
-

 Green2 weeks ago
Top Countries By Forest Growth Since 2001
-

 United States2 weeks ago
Ranked: The Largest U.S. Corporations by Number of Employees
-

 Maps2 weeks ago
The Largest Earthquakes in the New York Area (1970-2024)
-

 Green2 weeks ago
Ranked: The Countries With the Most Air Pollution in 2023