Markets
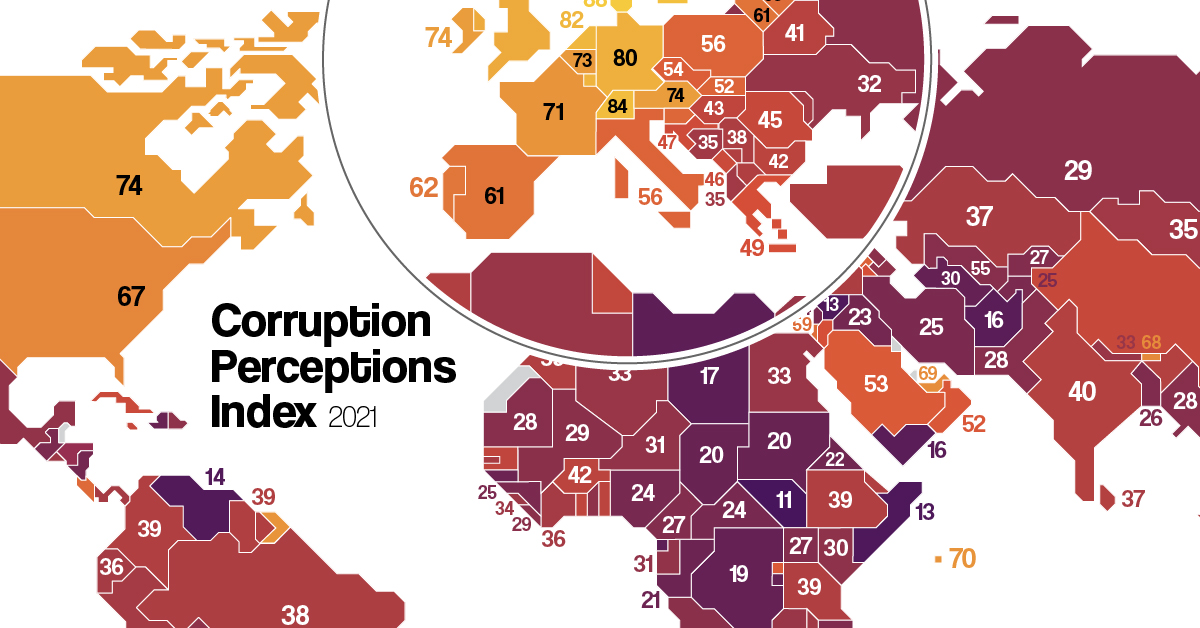
Mapped: Corruption in Countries Around the World
For more detail, view the full-sized version of this infographic
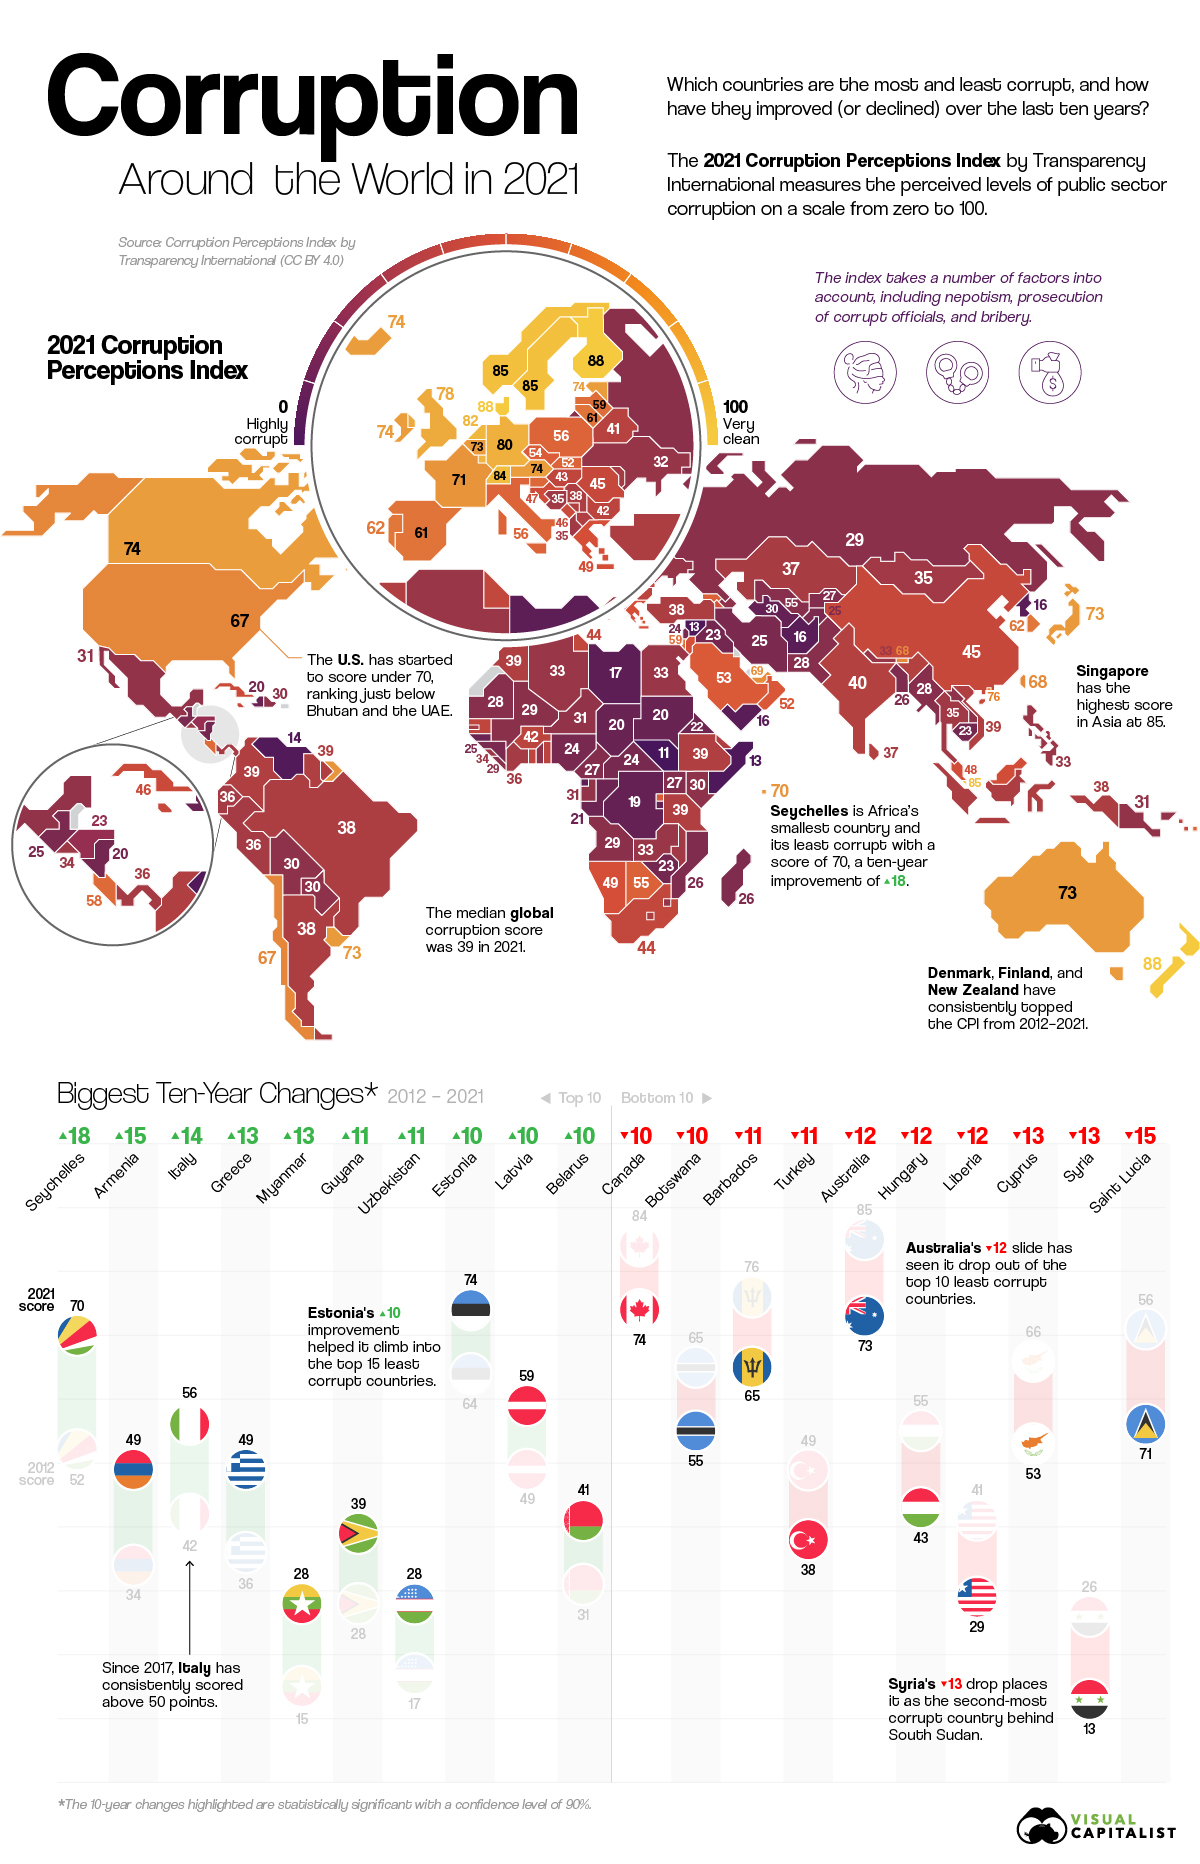


Mapped: Corruption in Countries Around the World
How bad is public sector corruption around the world, and how do different countries compare?
No matter your system of government, the public sector plays a vital role in establishing your economic mobility and political freedoms. Measuring corruption—the abuse of power for private gain—reveals how equal a system truly is.
For more than a decade, the Corruption Perceptions Index (CPI) by Transparency International has been the world’s most widely-used metric for scoring corruption. This infographic uses the 2021 CPI to visualize corruption in countries around the world, and the biggest 10-year changes.
Which Countries are Most (and Least) Corrupt?
How do you measure corruption, which includes behind-the-scenes deals, nepotism, corrupt prosecution, and bribery?
Over the last few decades, the CPI has found success doing so indirectly through perceptions.
By aggregating multiple analyses from country and business experts, the index assigns each country a score on a scale of 0 to 100, where 0 is highly corrupt and 100 is very clean.
Here are the results of the 2021 CPI, with the least corrupt countries at the top:
| Corruption Perception by Country | Score (2021) |
|---|---|
| Denmark | 88 |
| Finland | 88 |
| New Zealand | 88 |
| Norway | 85 |
| Singapore | 85 |
| Sweden | 85 |
| Switzerland | 84 |
| Netherlands | 82 |
| Luxembourg | 81 |
| Germany | 80 |
| UK | 78 |
| Hong Kong | 76 |
| Austria | 74 |
| Canada | 74 |
| Estonia | 74 |
| Iceland | 74 |
| Ireland | 74 |
| Australia | 73 |
| Belgium | 73 |
| Japan | 73 |
| Uruguay | 73 |
| France | 71 |
| Seychelles | 70 |
| UAE | 69 |
| Bhutan | 68 |
| Taiwan | 68 |
| Chile | 67 |
| U.S. | 67 |
| Barbados | 65 |
| Bahamas | 64 |
| Qatar | 63 |
| Portugal | 62 |
| South Korea | 62 |
| Lithuania | 61 |
| Spain | 61 |
| Israel | 59 |
| Latvia | 59 |
| Saint Vincent and the Grenadines | 59 |
| Cabo Verde | 58 |
| Costa Rica | 58 |
| Slovenia | 57 |
| Italy | 56 |
| Poland | 56 |
| Saint Lucia | 56 |
| Botswana | 55 |
| Dominica | 55 |
| Fiji | 55 |
| Georgia | 55 |
| Czechia | 54 |
| Malta | 54 |
| Mauritius | 54 |
| Cyprus | 53 |
| Grenada | 53 |
| Rwanda | 53 |
| Saudi Arabia | 53 |
| Oman | 52 |
| Slovakia | 52 |
| Armenia | 49 |
| Greece | 49 |
| Jordan | 49 |
| Namibia | 49 |
| Malaysia | 48 |
| Croatia | 47 |
| Cuba | 46 |
| Montenegro | 46 |
| China | 45 |
| Romania | 45 |
| Sao Tome and Principe | 45 |
| Vanuatu | 45 |
| Jamaica | 44 |
| South Africa | 44 |
| Tunisia | 44 |
| Ghana | 43 |
| Hungary | 43 |
| Kuwait | 43 |
| Senegal | 43 |
| Solomon Islands | 43 |
| Bahrain | 42 |
| Benin | 42 |
| Bulgaria | 42 |
| Burkina Faso | 42 |
| Belarus | 41 |
| Timor-Leste | 41 |
| Trinidad and Tobago | 41 |
| India | 40 |
| Maldives | 40 |
| Colombia | 39 |
| Ethiopia | 39 |
| Guyana | 39 |
| Kosovo | 39 |
| Morocco | 39 |
| North Macedonia | 39 |
| Suriname | 39 |
| Tanzania | 39 |
| Vietnam | 39 |
| Argentina | 38 |
| Brazil | 38 |
| Indonesia | 38 |
| Lesotho | 38 |
| Serbia | 38 |
| Turkey | 38 |
| Gambia | 37 |
| Kazakhstan | 37 |
| Sri Lanka | 37 |
| Cote d'Ivoire | 36 |
| Ecuador | 36 |
| Moldova | 36 |
| Panama | 36 |
| Peru | 36 |
| Albania | 35 |
| Bosnia and Herzegovina | 35 |
| Malawi | 35 |
| Mongolia | 35 |
| Thailand | 35 |
| El Salvador | 34 |
| Sierra Leone | 34 |
| Algeria | 33 |
| Egypt | 33 |
| Nepal | 33 |
| Philippines | 33 |
| Zambia | 33 |
| Eswatini | 32 |
| Ukraine | 32 |
| Gabon | 31 |
| Mexico | 31 |
| Niger | 31 |
| Papua New Guinea | 31 |
| Azerbaijan | 30 |
| Bolivia | 30 |
| Djibouti | 30 |
| Dominican Republic | 30 |
| Kenya | 30 |
| Laos | 30 |
| Paraguay | 30 |
| Togo | 30 |
| Angola | 29 |
| Liberia | 29 |
| Mali | 29 |
| Russia | 29 |
| Mauritania | 28 |
| Myanmar | 28 |
| Pakistan | 28 |
| Uzbekistan | 28 |
| Cameroon | 27 |
| Kyrgyzstan | 27 |
| Uganda | 27 |
| Bangladesh | 26 |
| Madagascar | 26 |
| Mozambique | 26 |
| Guatemala | 25 |
| Guinea | 25 |
| Iran | 25 |
| Tajikistan | 25 |
| Central African Republic | 24 |
| Lebanon | 24 |
| Nigeria | 24 |
| Cambodia | 23 |
| Honduras | 23 |
| Iraq | 23 |
| Zimbabwe | 23 |
| Eritrea | 22 |
| Congo | 21 |
| Guinea-Bissau | 21 |
| Chad | 20 |
| Comoros | 20 |
| Haiti | 20 |
| Nicaragua | 20 |
| Sudan | 20 |
| Burundi | 19 |
| Democratic Republic of the Congo | 19 |
| Turkmenistan | 19 |
| Equatorial Guinea | 17 |
| Libya | 17 |
| Afghanistan | 16 |
| North Korea | 16 |
| Yemen | 16 |
| Venezuela | 14 |
| Somalia | 13 |
| Syria | 13 |
| South Sudan | 11 |
Ranking at the top of the index with scores of 88 are Nordic countries Denmark and Finland, as well as New Zealand.
They’ve consistently topped the CPI over the last decade, and Europe in general had 14 of the top 20 least corrupt countries. Asia also had many notable entrants, including Singapore (tied for #4), Hong Kong (#12), and Japan (tied for #18).
Comparatively, the Americas only had two countries score in the top 20 least corrupt: Canada (tied for #13) and Uruguay (tied for #18). With a score of 67, the U.S. scored at #28 just behind Bhutan, the UAE, and France.
Scoring towards the bottom of the index were many countries currently and historically going through conflict, primarily located in the Middle East and Africa. They include Afghanistan, Venezuela, Somalia, and South Sudan. The latter country finishes at the very bottom of the list, with a score of just 11.
How Corruption in Countries Has Changed (2012–2021)
Corruption is a constant and moving global problem, so it’s also important to measure which countries have had their images improved (or worsened).
By using CPI scores dating back to 2012, we can examine how country scores have changed over the last decade:
| Change in Corruption by Country | 10-Year Trend (2012-2021) |
|---|---|
| Seychelles | +18 |
| Armenia | +15 |
| Italy | +14 |
| Greece | +13 |
| Myanmar | +13 |
| Guyana | +11 |
| Uzbekistan | +11 |
| Estonia | +10 |
| Latvia | +10 |
| Belarus | +10 |
| Saudi Arabia | +9 |
| Kazakhstan | +9 |
| Laos | +9 |
| Timor-Leste | +8 |
| Vietnam | +8 |
| Afghanistan | +8 |
| North Korea | +8 |
| Taiwan | +7 |
| Lithuania | +7 |
| Senegal | +7 |
| Cote d'Ivoire | +7 |
| Angola | +7 |
| Sudan | +7 |
| South Korea | +6 |
| Slovakia | +6 |
| China | +6 |
| Jamaica | +6 |
| Benin | +6 |
| Ethiopia | +6 |
| Indonesia | +6 |
| Nepal | +6 |
| Ukraine | +6 |
| Papua New Guinea | +6 |
| Austria | +5 |
| Ireland | +5 |
| Bhutan | +5 |
| Czechia | +5 |
| Oman | +5 |
| Montenegro | +5 |
| Kosovo | +5 |
| Paraguay | +5 |
| Iraq | +5 |
| Somalia | +5 |
| United Kingdom | +4 |
| Costa Rica | +4 |
| Burkina Faso | +4 |
| India | +4 |
| Tanzania | +4 |
| Ecuador | +4 |
| Georgia | +3 |
| Sao Tome and Principe | +3 |
| Tunisia | +3 |
| Colombia | +3 |
| Argentina | +3 |
| Gambia | +3 |
| Sierra Leone | +3 |
| Azerbaijan | +3 |
| Kenya | +3 |
| Kyrgyzstan | +3 |
| Tajikistan | +3 |
| Zimbabwe | +3 |
| Trinidad and Tobago | +2 |
| Morocco | +2 |
| Suriname | +2 |
| Albania | +2 |
| Turkmenistan | +2 |
| Luxembourg | +1 |
| Germany | +1 |
| Uruguay | +1 |
| United Arab Emirates | +1 |
| Jordan | +1 |
| Namibia | +1 |
| Croatia | +1 |
| Romania | +1 |
| South Africa | +1 |
| Bulgaria | +1 |
| Egypt | +1 |
| Russia | +1 |
| Pakistan | +1 |
| Cameroon | +1 |
| Guinea | +1 |
| Cambodia | +1 |
| Haiti | +1 |
| Chad | +1 |
| Norway | 0 |
| France | 0 |
| Rwanda | 0 |
| Moldova | 0 |
| Togo | 0 |
| Bangladesh | 0 |
| Burundi | 0 |
| Hong Kong | -1 |
| Japan | -1 |
| Portugal | -1 |
| Israel | -1 |
| Malaysia | -1 |
| Kuwait | -1 |
| Serbia | -1 |
| Mongolia | -1 |
| Algeria | -1 |
| Philippines | -1 |
| Denmark | -2 |
| Finland | -2 |
| New Zealand | -2 |
| Singapore | -2 |
| Switzerland | -2 |
| Netherlands | -2 |
| Belgium | -2 |
| Cabo Verde | -2 |
| Poland | -2 |
| Cuba | -2 |
| Ghana | -2 |
| Panama | -2 |
| Peru | -2 |
| Malawi | -2 |
| Thailand | -2 |
| Niger | -2 |
| Dominican Republic | -2 |
| Uganda | -2 |
| Central African Republic | -2 |
| Democratic Republic of the Congo | -2 |
| Sweden | -3 |
| Saint Vincent and the Grenadines | -3 |
| Dominica | -3 |
| Malta | -3 |
| Mauritius | -3 |
| Sri Lanka | -3 |
| Mexico | -3 |
| Mauritania | -3 |
| Iran | -3 |
| Nigeria | -3 |
| Eritrea | -3 |
| Equatorial Guinea | -3 |
| Spain | -4 |
| Slovenia | -4 |
| North Macedonia | -4 |
| El Salvador | -4 |
| Zambia | -4 |
| Gabon | -4 |
| Bolivia | -4 |
| Guinea-Bissau | -4 |
| Libya | -4 |
| Chile | -5 |
| Qatar | -5 |
| Brazil | -5 |
| Eswatini | -5 |
| Mali | -5 |
| Mozambique | -5 |
| Honduras | -5 |
| Congo | -5 |
| Venezuela | -5 |
| United States of America | -6 |
| Djibouti | -6 |
| Madagascar | -6 |
| Lebanon | -6 |
| Bahamas | -7 |
| Lesotho | -7 |
| Bosnia and Herzegovina | -7 |
| Yemen | -7 |
| Iceland | -8 |
| Guatemala | -8 |
| Comoros | -8 |
| Bahrain | -9 |
| Nicaragua | -9 |
| Canada | -10 |
| Botswana | -10 |
| Barbados | -11 |
| Turkey | -11 |
| Australia | -12 |
| Hungary | -12 |
| Liberia | -12 |
| Cyprus | -13 |
| Syria | -13 |
| Saint Lucia | -15 |
| Fiji | N/A |
| Grenada | N/A |
| Vanuatu | N/A |
| Solomon Islands | N/A |
| Maldives | N/A |
| South Sudan | N/A |
The biggest climber with +18 was Seychelles, Africa’s smallest country and also its least corrupt with a score of 70. Other notable improvements include neighboring countries Estonia, Latvia, and Belarus, with Estonia rising into the top 15 least corrupt countries.
On the opposite side, both Australia (-12) and Canada (-10) have actually fallen out of the top 10 least corrupt countries over the last decade. They’re joined by decreases in Hungary (-12) and Syria (-13), which is now ranked as the world’s second-most corrupt country.
Which countries will rise and fall in corruption perceptions over the next 10 years, and how do your perceptions compare with this list?


Markets
The European Stock Market: Attractive Valuations Offer Opportunities
On average, the European stock market has valuations that are nearly 50% lower than U.S. valuations. But how can you access the market?


European Stock Market: Attractive Valuations Offer Opportunities
Europe is known for some established brands, from L’Oréal to Louis Vuitton. However, the European stock market offers additional opportunities that may be lesser known.
The above infographic, sponsored by STOXX, outlines why investors may want to consider European stocks.
Attractive Valuations
Compared to most North American and Asian markets, European stocks offer lower or comparable valuations.
| Index | Price-to-Earnings Ratio | Price-to-Book Ratio |
|---|---|---|
| EURO STOXX 50 | 14.9 | 2.2 |
| STOXX Europe 600 | 14.4 | 2 |
| U.S. | 25.9 | 4.7 |
| Canada | 16.1 | 1.8 |
| Japan | 15.4 | 1.6 |
| Asia Pacific ex. China | 17.1 | 1.8 |
Data as of February 29, 2024. See graphic for full index names. Ratios based on trailing 12 month financials. The price to earnings ratio excludes companies with negative earnings.
On average, European valuations are nearly 50% lower than U.S. valuations, potentially offering an affordable entry point for investors.
Research also shows that lower price ratios have historically led to higher long-term returns.
Market Movements Not Closely Connected
Over the last decade, the European stock market had low-to-moderate correlation with North American and Asian equities.
The below chart shows correlations from February 2014 to February 2024. A value closer to zero indicates low correlation, while a value of one would indicate that two regions are moving in perfect unison.
| EURO STOXX 50 | STOXX EUROPE 600 | U.S. | Canada | Japan | Asia Pacific ex. China |
|
|---|---|---|---|---|---|---|
| EURO STOXX 50 | 1.00 | 0.97 | 0.55 | 0.67 | 0.24 | 0.43 |
| STOXX EUROPE 600 | 1.00 | 0.56 | 0.71 | 0.28 | 0.48 | |
| U.S. | 1.00 | 0.73 | 0.12 | 0.25 | ||
| Canada | 1.00 | 0.22 | 0.40 | |||
| Japan | 1.00 | 0.88 | ||||
| Asia Pacific ex. China | 1.00 |
Data is based on daily USD returns.
European equities had relatively independent market movements from North American and Asian markets. One contributing factor could be the differing sector weights in each market. For instance, technology makes up a quarter of the U.S. market, but health care and industrials dominate the broader European market.
Ultimately, European equities can enhance portfolio diversification and have the potential to mitigate risk for investors.
Tracking the Market
For investors interested in European equities, STOXX offers a variety of flagship indices:
| Index | Description | Market Cap |
|---|---|---|
| STOXX Europe 600 | Pan-regional, broad market | €10.5T |
| STOXX Developed Europe | Pan-regional, broad-market | €9.9T |
| STOXX Europe 600 ESG-X | Pan-regional, broad market, sustainability focus | €9.7T |
| STOXX Europe 50 | Pan-regional, blue-chip | €5.1T |
| EURO STOXX 50 | Eurozone, blue-chip | €3.5T |
Data is as of February 29, 2024. Market cap is free float, which represents the shares that are readily available for public trading on stock exchanges.
The EURO STOXX 50 tracks the Eurozone’s biggest and most traded companies. It also underlies one of the world’s largest ranges of ETFs and mutual funds. As of November 2023, there were €27.3 billion in ETFs and €23.5B in mutual fund assets under management tracking the index.
“For the past 25 years, the EURO STOXX 50 has served as an accurate, reliable and tradable representation of the Eurozone equity market.”
— Axel Lomholt, General Manager at STOXX
Partnering with STOXX to Track the European Stock Market
Are you interested in European equities? STOXX can be a valuable partner:
- Comprehensive, liquid and investable ecosystem
- European heritage, global reach
- Highly sophisticated customization capabilities
- Open architecture approach to using data
- Close partnerships with clients
- Part of ISS STOXX and Deutsche Börse Group
With a full suite of indices, STOXX can help you benchmark against the European stock market.
Learn how STOXX’s European indices offer liquid and effective market access.

-

 Economy1 day ago
Economic Growth Forecasts for G7 and BRICS Countries in 2024
The IMF has released its economic growth forecasts for 2024. How do the G7 and BRICS countries compare?
-

 Markets1 week ago
U.S. Debt Interest Payments Reach $1 Trillion
U.S. debt interest payments have surged past the $1 trillion dollar mark, amid high interest rates and an ever-expanding debt burden.
-

 United States1 week ago
Ranked: The Largest U.S. Corporations by Number of Employees
We visualized the top U.S. companies by employees, revealing the massive scale of retailers like Walmart, Target, and Home Depot.
-

 Markets2 weeks ago
The Top 10 States by Real GDP Growth in 2023
This graphic shows the states with the highest real GDP growth rate in 2023, largely propelled by the oil and gas boom.
-

 Markets2 weeks ago
Ranked: The World’s Top Flight Routes, by Revenue
In this graphic, we show the highest earning flight routes globally as air travel continued to rebound in 2023.
-

 Markets2 weeks ago
Ranked: The Most Valuable Housing Markets in America
The U.S. residential real estate market is worth a staggering $47.5 trillion. Here are the most valuable housing markets in the country.


-

 Mining1 week ago
Gold vs. S&P 500: Which Has Grown More Over Five Years?
-
Markets2 weeks ago
Ranked: The Most Valuable Housing Markets in America
-

 Money2 weeks ago
Which States Have the Highest Minimum Wage in America?
-

 AI2 weeks ago
Ranked: Semiconductor Companies by Industry Revenue Share
-
Markets2 weeks ago
Ranked: The World’s Top Flight Routes, by Revenue
-

 Demographics2 weeks ago
Population Projections: The World’s 6 Largest Countries in 2075
-
Markets2 weeks ago
The Top 10 States by Real GDP Growth in 2023
-

 Demographics2 weeks ago
The Smallest Gender Wage Gaps in OECD Countries