Markets
Mapped: America’s $2 Trillion Economic Drop, by State and Sector
Mapped: America’s $2 Trillion Economic Drop
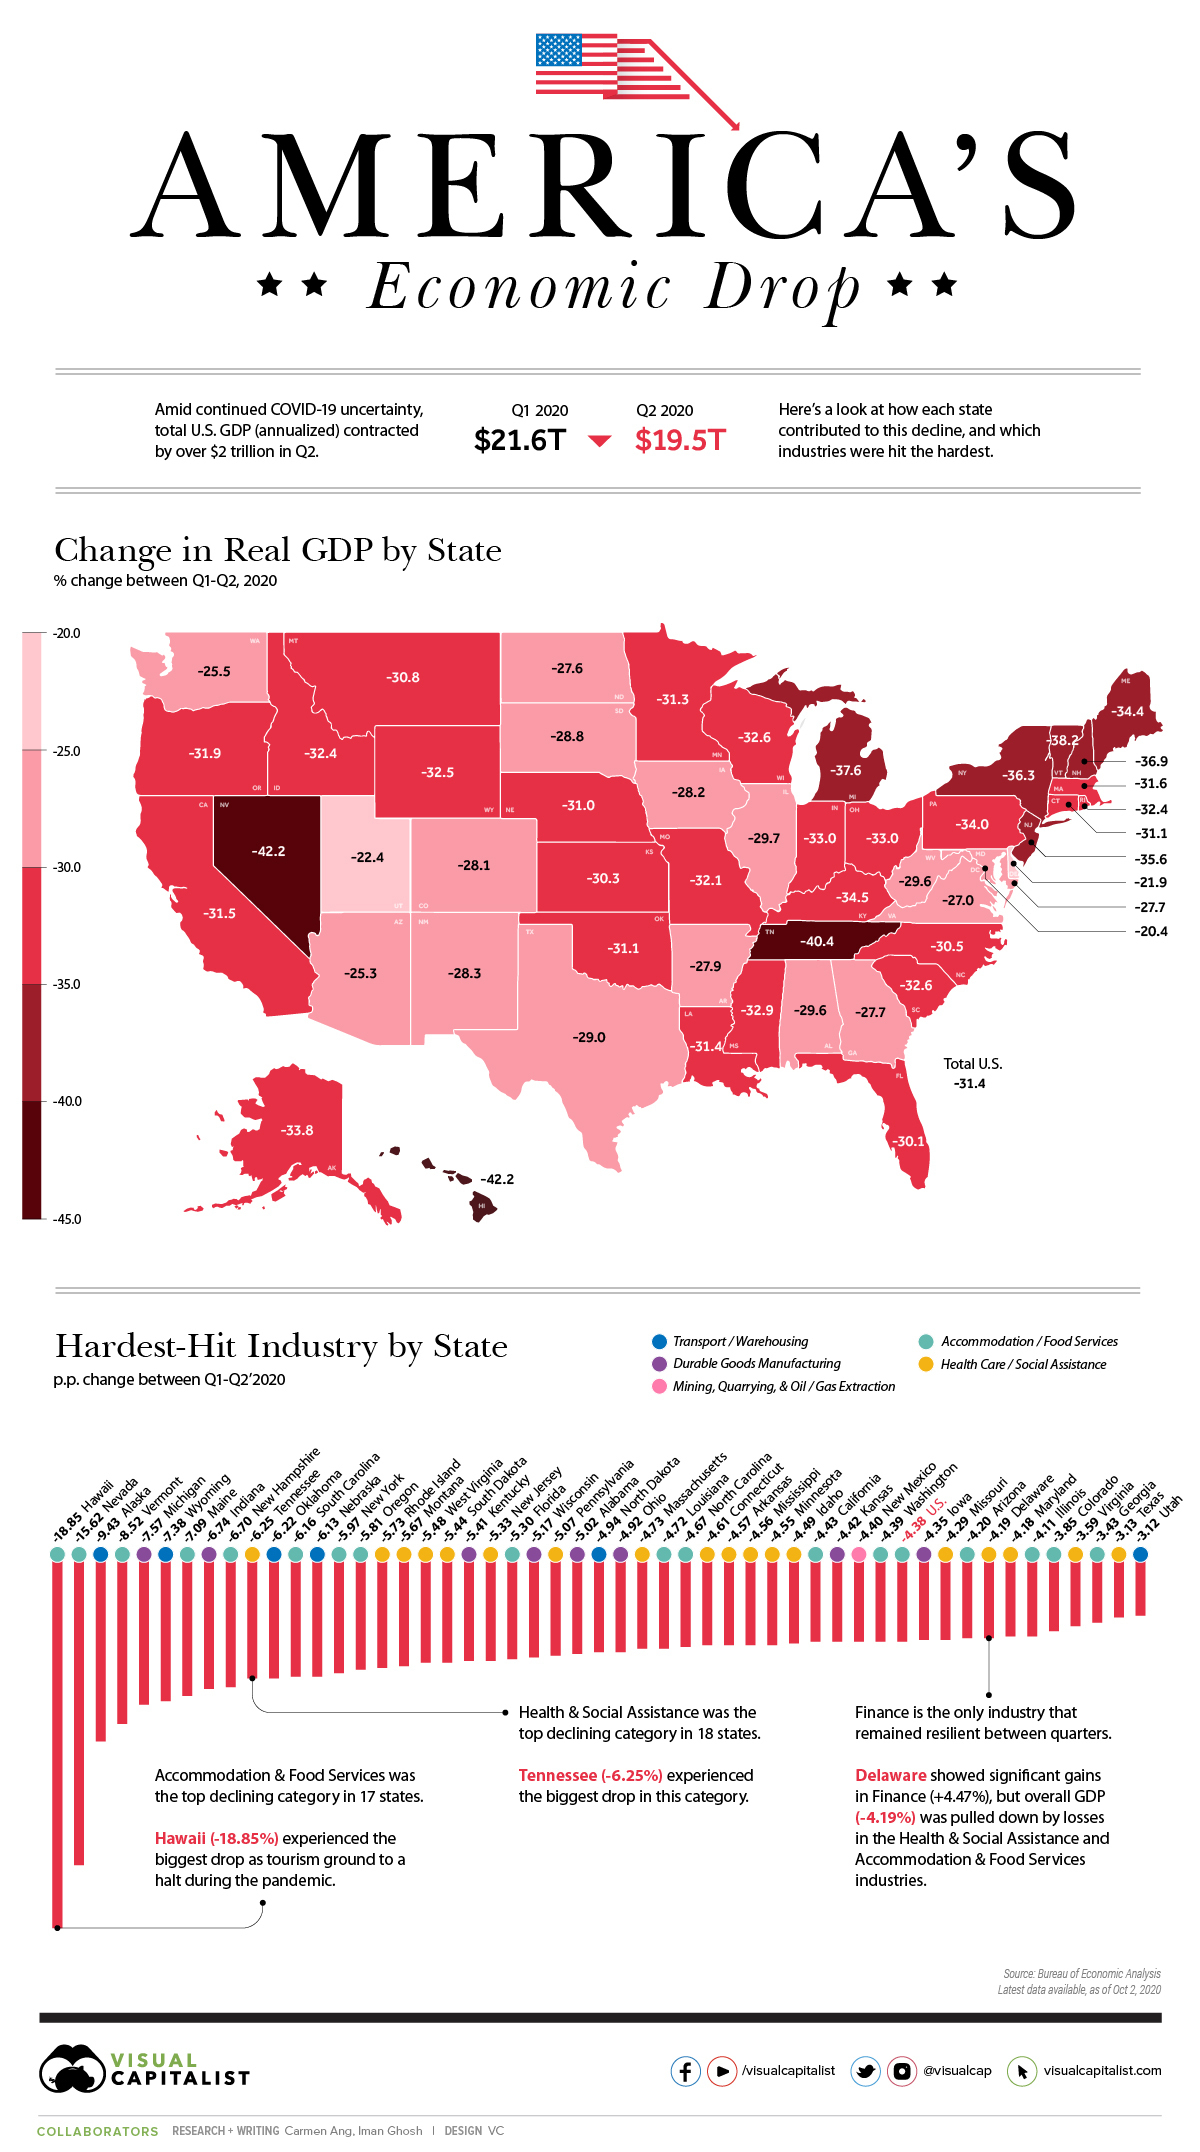
It only took a handful of months for the U.S. economy to reel from COVID-19’s effects.
As unemployment rates hit all-time highs and businesses scrambled to stay afloat, new data shows that current dollar GDP plummeted from nearly $21.6 trillion down to $19.5 trillion between Q1’2020 and Q2’2020 (seasonally adjusted at annual rates).
While all states experienced a decline, the effects were not distributed equally across the nation. This visualization takes a look at the latest data from the Bureau of Economic Analysis, uncovering the biggest declines across states, and which industries were most affected by COVID-19 related closures and uncertainty.
Change in GDP by State and Industry
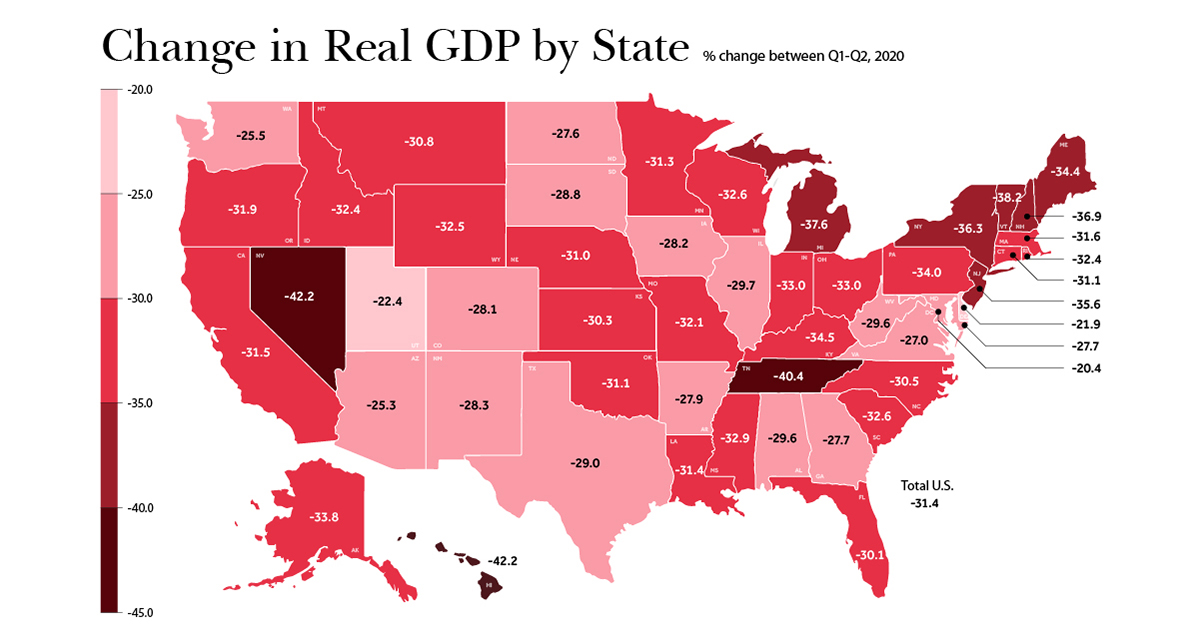
Between March-June 2020, stay-at-home orders resulted in disruptions to consumer activity, health, and the broader economy, causing U.S. GDP to fall by 31.4% from numbers posted in Q1.
The U.S. economy is the sum of its parts, with each state contributing to the total output—making the COVID-19 decline even more evident when state-by-state change in GDP is taken into consideration.
| State | Real GDP Change | Biggest Industry Decline | Industry Change (p.p.) |
|---|---|---|---|
| Alabama | -29.6 | Durable Goods Manufacturing | -5.02 |
| Alaska | -33.8 | Transport and Warehousing | -9.43 |
| Arizona | -25.3 | Accommodation and Food Services | -4.2 |
| Arkansas | -27.9 | Health Care and Social Assistance | -4.57 |
| California | -31.5 | Accommodation and Food Services | -4.43 |
| Colorado | -28.1 | Accommodation and Food Services | -3.85 |
| Connecticut | -31.1 | Health Care and Social Assistance | -4.61 |
| Delaware | -21.9 | Health Care and Social Assistance | -4.19 |
| Florida | -30.1 | Accommodation and Food Services | -5.3 |
| Georgia | -27.7 | Accommodation and Food Services | -3.43 |
| Hawaii | -42.2 | Accommodation and Food Services | -18.85 |
| Idaho | -32.4 | Health Care and Social Assistance | -4.49 |
| Illinois | -29.7 | Accommodation and Food Services | -4.11 |
| Indiana | -33.0 | Durable Goods Manufacturing | -6.74 |
| Iowa | -28.2 | Durable Goods Manufacturing | -4.35 |
| Kansas | -30.3 | Durable Goods Manufacturing | -4.42 |
| Kentucky | -34.5 | Durable Goods Manufacturing | -5.41 |
| Louisiana | -31.4 | Accommodation and Food Services | -4.72 |
| Maine | -34.4 | Accommodation and Food Services | -7.09 |
| Maryland | -27.7 | Health Care and Social Assistance | -4.18 |
| Massachusetts | -31.6 | Health Care and Social Assistance | -4.73 |
| Michigan | -37.6 | Durable Goods Manufacturing | -7.57 |
| Minnesota | -31.3 | Health Care and Social Assistance | -4.55 |
| Mississippi | -32.9 | Health Care and Social Assistance | -4.56 |
| Missouri | -32.1 | Health Care and Social Assistance | -4.29 |
| Montana | -30.8 | Health Care and Social Assistance | -5.67 |
| Nebraska | -31.0 | Transport and Warehousing | -6.13 |
| Nevada | -42.2 | Accommodation and Food Services | -15.62 |
| New Hampshire | -36.9 | Accommodation and Food Services | -6.7 |
| New Jersey | -35.6 | Health Care and Social Assistance | -5.33 |
| New Mexico | -28.3 | Mining, Quarrying, and Oil and Gas Extraction | -4.4 |
| New York | -36.3 | Accommodation and Food Services | -5.97 |
| North Carolina | -30.5 | Accommodation and Food Services | -4.67 |
| North Dakota | -27.6 | Transport and Warehousing | -4.94 |
| Ohio | -33.0 | Durable Goods Manufacturing | -4.92 |
| Oklahoma | -31.1 | Transport and Warehousing | -6.22 |
| Oregon | -31.9 | Accommodation and Food Services | -5.81 |
| Pennsylvania | -34.0 | Health Care and Social Assistance | -5.07 |
| Rhode Island | -32.4 | Health Care and Social Assistance | -5.73 |
| South Carolina | -32.6 | Accommodation and Food Services | -6.16 |
| South Dakota | -28.8 | Health Care and Social Assistance | -5.44 |
| Tennessee | -40.4 | Health Care and Social Assistance | -6.25 |
| Texas | -29.0 | Health Care and Social Assistance | -3.13 |
| Utah | -22.4 | Transport and Warehousing | -3.12 |
| Vermont | -38.2 | Accommodation and Food Services | -8.52 |
| Virginia | -27.0 | Health Care and Social Assistance | -3.59 |
| Washington | -25.5 | Accommodation and Food Services | -4.39 |
| West Virginia | -29.6 | Health Care and Social Assistance | -5.48 |
| Wisconsin | -32.6 | Durable Goods Manufacturing | -5.17 |
| Wyoming | -32.5 | Transport and Warehousing | -7.38 |
| 🇺🇸 U.S. | -31.4 | Accommodation and Food Services | -4.38 |
Note: Industry changes are reported in percentage points (p.p.) of total current dollar GDP between Q1 and Q2.
A total of 18 states took the biggest hit within the Accommodation & Food Services sector, which was also the industry that suffered the most nationally, dropping by 4.38%.
Highly dependent on tourism, Hawaii bore the brunt of decline in this industry with a 18.85% drop. According to The Economic Research Organization at the University of Hawaii (UHERO), a second wave of infections and expired financial assistance were behind this contraction.
Next, the Health Care & Social Assistance sector was most impacted in 17 states between the two quarters, falling the most in Tennessee (-6.25%).
The most resilient industry amid the pandemic was Financial Services. In the state of Delaware, home to major banks such as JPMorgan Chase and Capital One, the sector actually grew by 4.47%. However, Delaware’s GDP ultimately still fell due to contractions in other sectors.
Each Industry’s Worst Performing State
Looking at it another way, the worst-performing state by industry also becomes clear when the change in percentage points (p.p.) Q1’–Q2’2020 GDP contributions are measured. Of the 21 industries profiled, Nevada shows up in the lower end of the spectrum four times.
| Industry | Worst-performing state | Change (p.p.) |
|---|---|---|
| Agriculture, forestry, fishing and hunting | Nebraska | -4.99% |
| Mining, quarrying, and oil and gas extraction | Wyoming | -5.76% |
| Utilities | Nebraska | -0.33% |
| Construction | New York | -2.02% |
| Durable goods manufacturing | Michigan | -7.57% |
| Nondurable goods manufacturing | Indiana | -2.65% |
| Wholesale trade | New Jersey | -3.35% |
| Retail trade | Nevada | -2.88% |
| Transportation and warehousing | Alaska | -9.43% |
| Information | California | -0.88% |
| Finance and insurance | South Dakota | -1.53% |
| Real estate and rental and leasing | Florida | -2.00% |
| Professional, scientific, and technical services | District of Columbia | -4.46% |
| Management of companies and enterprises | Nevada | -0.38% |
| Administrative/ support /waste management / remediation | Nevada | -2.48% |
| Educational services | Rhode Island | -1.47% |
| Health care and social assistance | Tennessee | -6.25% |
| Arts, entertainment, and recreation | Nevada | -4.44% |
| Accommodation and food services | Hawaii | -18.85% |
| Other services (ex. govt) | District of Columbia | -2.40% |
| Government and government enterprises | Alaska | -4.19% |
With many U.S. business leaders expecting a second contraction to occur in the economy, will future figures reflect further declines, or will states manage to bounce back?


Markets
The Best U.S. Companies to Work for According to LinkedIn
We visualized the results of a LinkedIn study on the best U.S. companies to work for in 2024.
The Best U.S. Companies to Work for According to LinkedIn
This was originally posted on our Voronoi app. Download the app for free on iOS or Android and discover incredible data-driven charts from a variety of trusted sources.
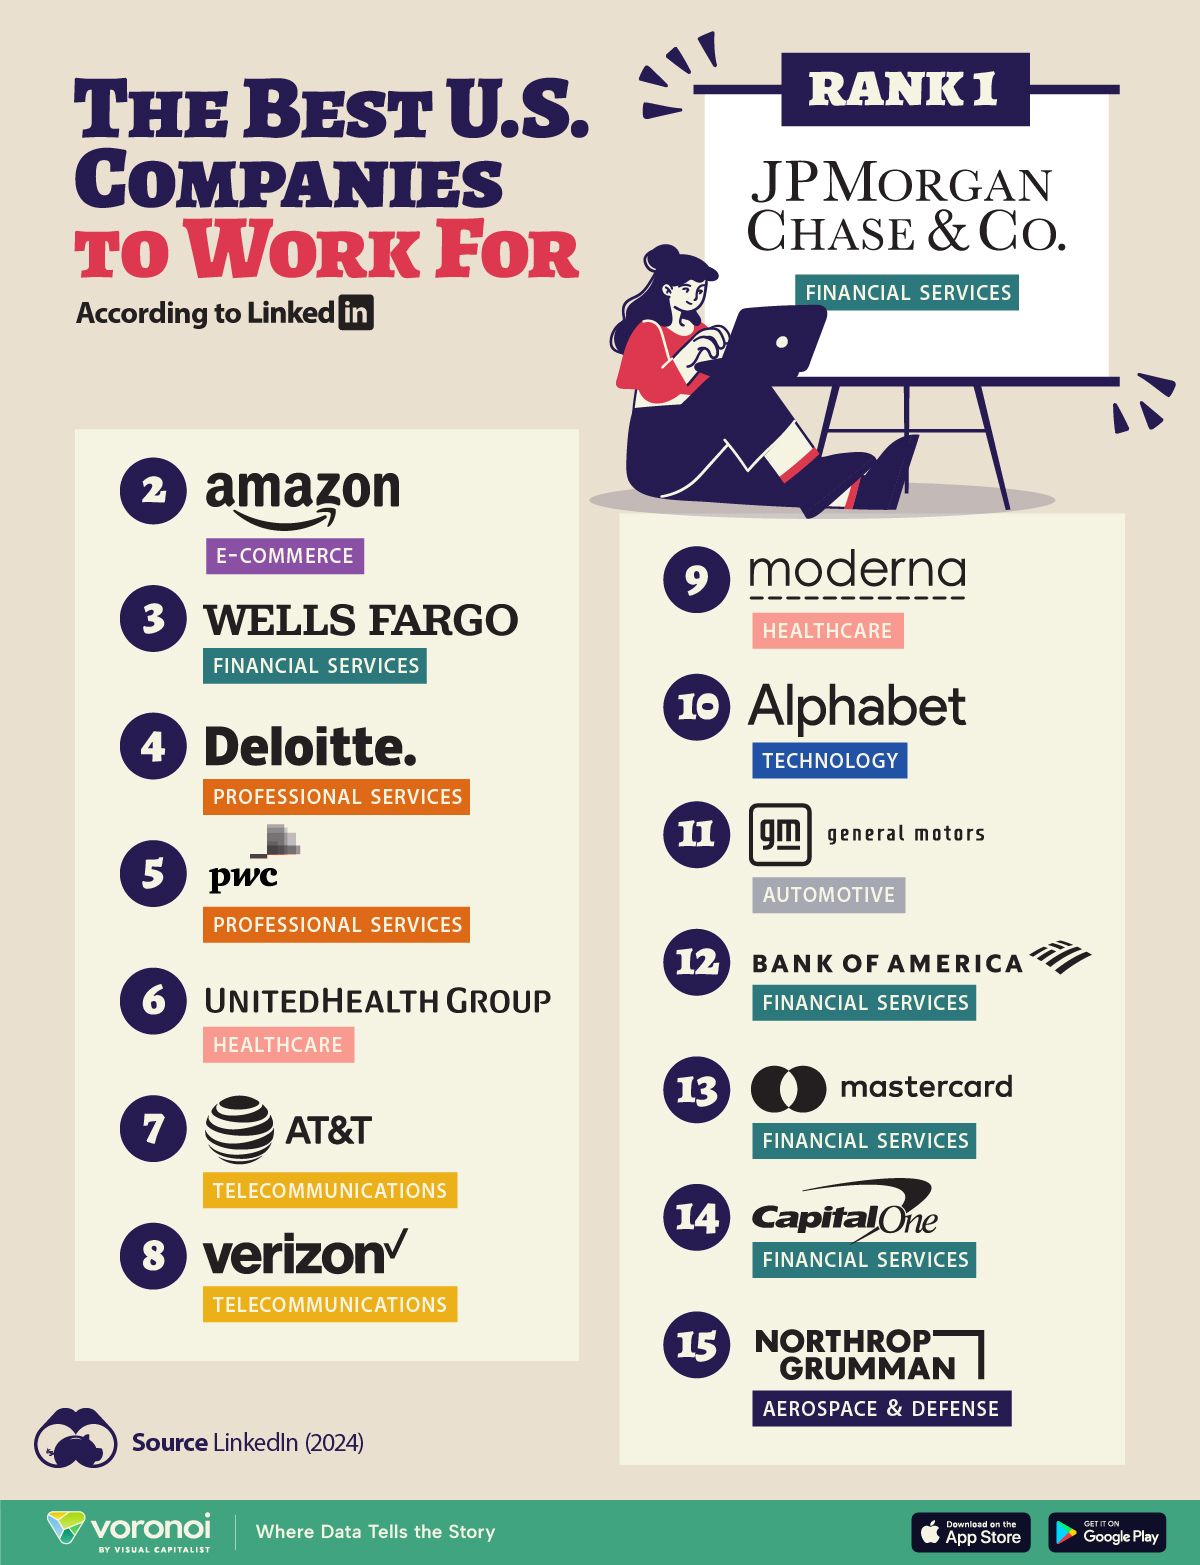
In this graphic, we list the 15 best U.S. companies to work for in 2024, according to LinkedIn data.
LinkedIn ranked companies based on eight pillars: ability to advance, skills growth, company stability, external opportunity, company affinity, gender diversity, educational background, and employee presence in the country.
To be eligible, companies must have had 5,000 or more global employees, with at least 500 in the country as of December 31, 2023.
Data and Highlights
Financial institutions dominate the ranking of the best U.S. companies to work for in 2024, with JP Morgan Chase & Co. ranking first.
| Rank | Company | Industry |
|---|---|---|
| 1 | JP Morgan Chase & Co. | Financial Services |
| 2 | Amazon | E-commerce |
| 3 | Wells Fargo | Financial Services |
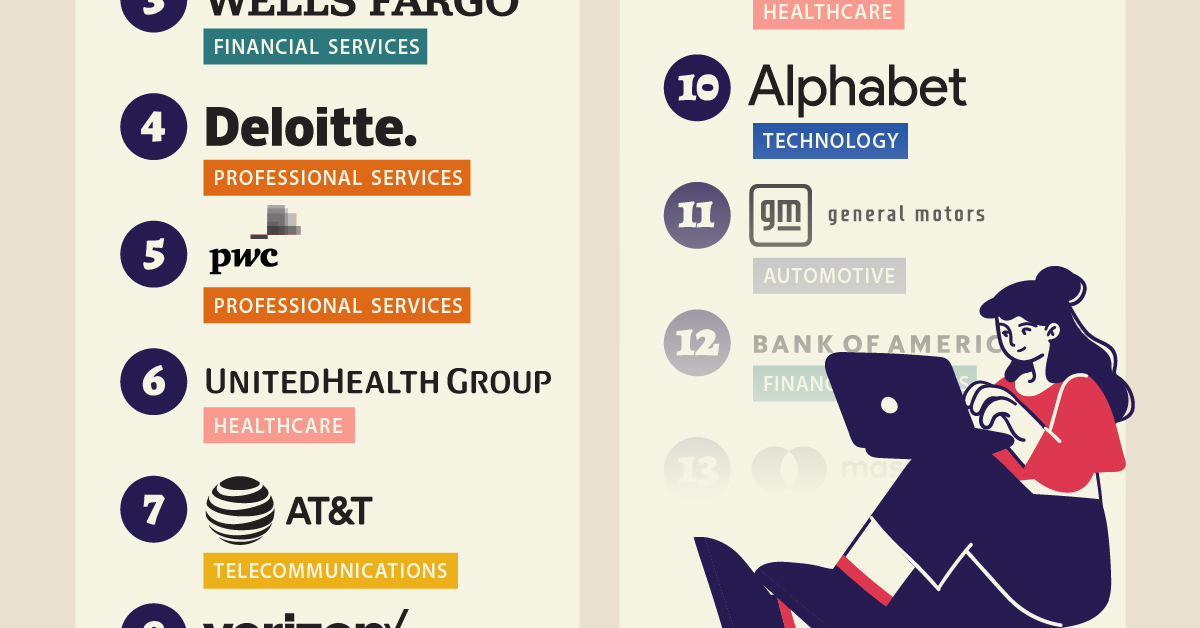
| 4 | Deloitte | Professional Services |
| 5 | PwC | Professional Services |
| 6 | UnitedHealth Group | Healthcare |
| 7 | AT&T | Telecommunications |
| 8 | Verizon | Telecommunications |
| 9 | Moderna | Pharmaceuticals |
| 10 | Alphabet Inc. | Technology |
| 11 | General Motors | Automotive |
| 12 | Bank of America | Financial Services |
| 13 | Mastercard | Financial Services |
| 14 | Capital One | Financial Services |
| 15 | Northrop Grumman | Aerospace & Defense |
J.P. Morgan has a program that offers opportunities for candidates without a university degree. In fact, in 2022, 75% of job descriptions at the bank for experienced hires did not require a college degree.
Meanwhile, Deloitte and Amazon offer a variety of free training courses, including in AI.
Moderna includes in its employee package benefits to help avoid employee burnout — from subsidized commuter expenses and pop-up daycare centers, to wellness coaches.
Mastercard offers flexible work availability, with 11.5% remote and 89% hybrid options.
It’s also interesting to note that only Amazon and Alphabet made the cut from the ‘Magnificent Seven’ companies (Apple, Microsoft, Google parent Alphabet, Amazon, Nvidia, Meta Platforms, and Tesla).
See more about the best companies to work for in this infographic, which covers a separate ranking from Glassdoor.

-

 Technology6 days ago
Visualizing AI Patents by Country
-

 Green2 weeks ago
Ranking the Top 15 Countries by Carbon Tax Revenue
-

 Markets2 weeks ago
U.S. Debt Interest Payments Reach $1 Trillion
-

 Mining2 weeks ago
Gold vs. S&P 500: Which Has Grown More Over Five Years?
-

 Uranium2 weeks ago
The World’s Biggest Nuclear Energy Producers
-

 Misc2 weeks ago
How Hard Is It to Get Into an Ivy League School?
-

 Debt2 weeks ago
How Debt-to-GDP Ratios Have Changed Since 2000
-

 Culture2 weeks ago
The Highest Earning Athletes in Seven Professional Sports