Markets
Mapped: America’s $2 Trillion Economic Drop, by State and Sector
Mapped: America’s $2 Trillion Economic Drop
It only took a handful of months for the U.S. economy to reel from COVID-19’s effects.
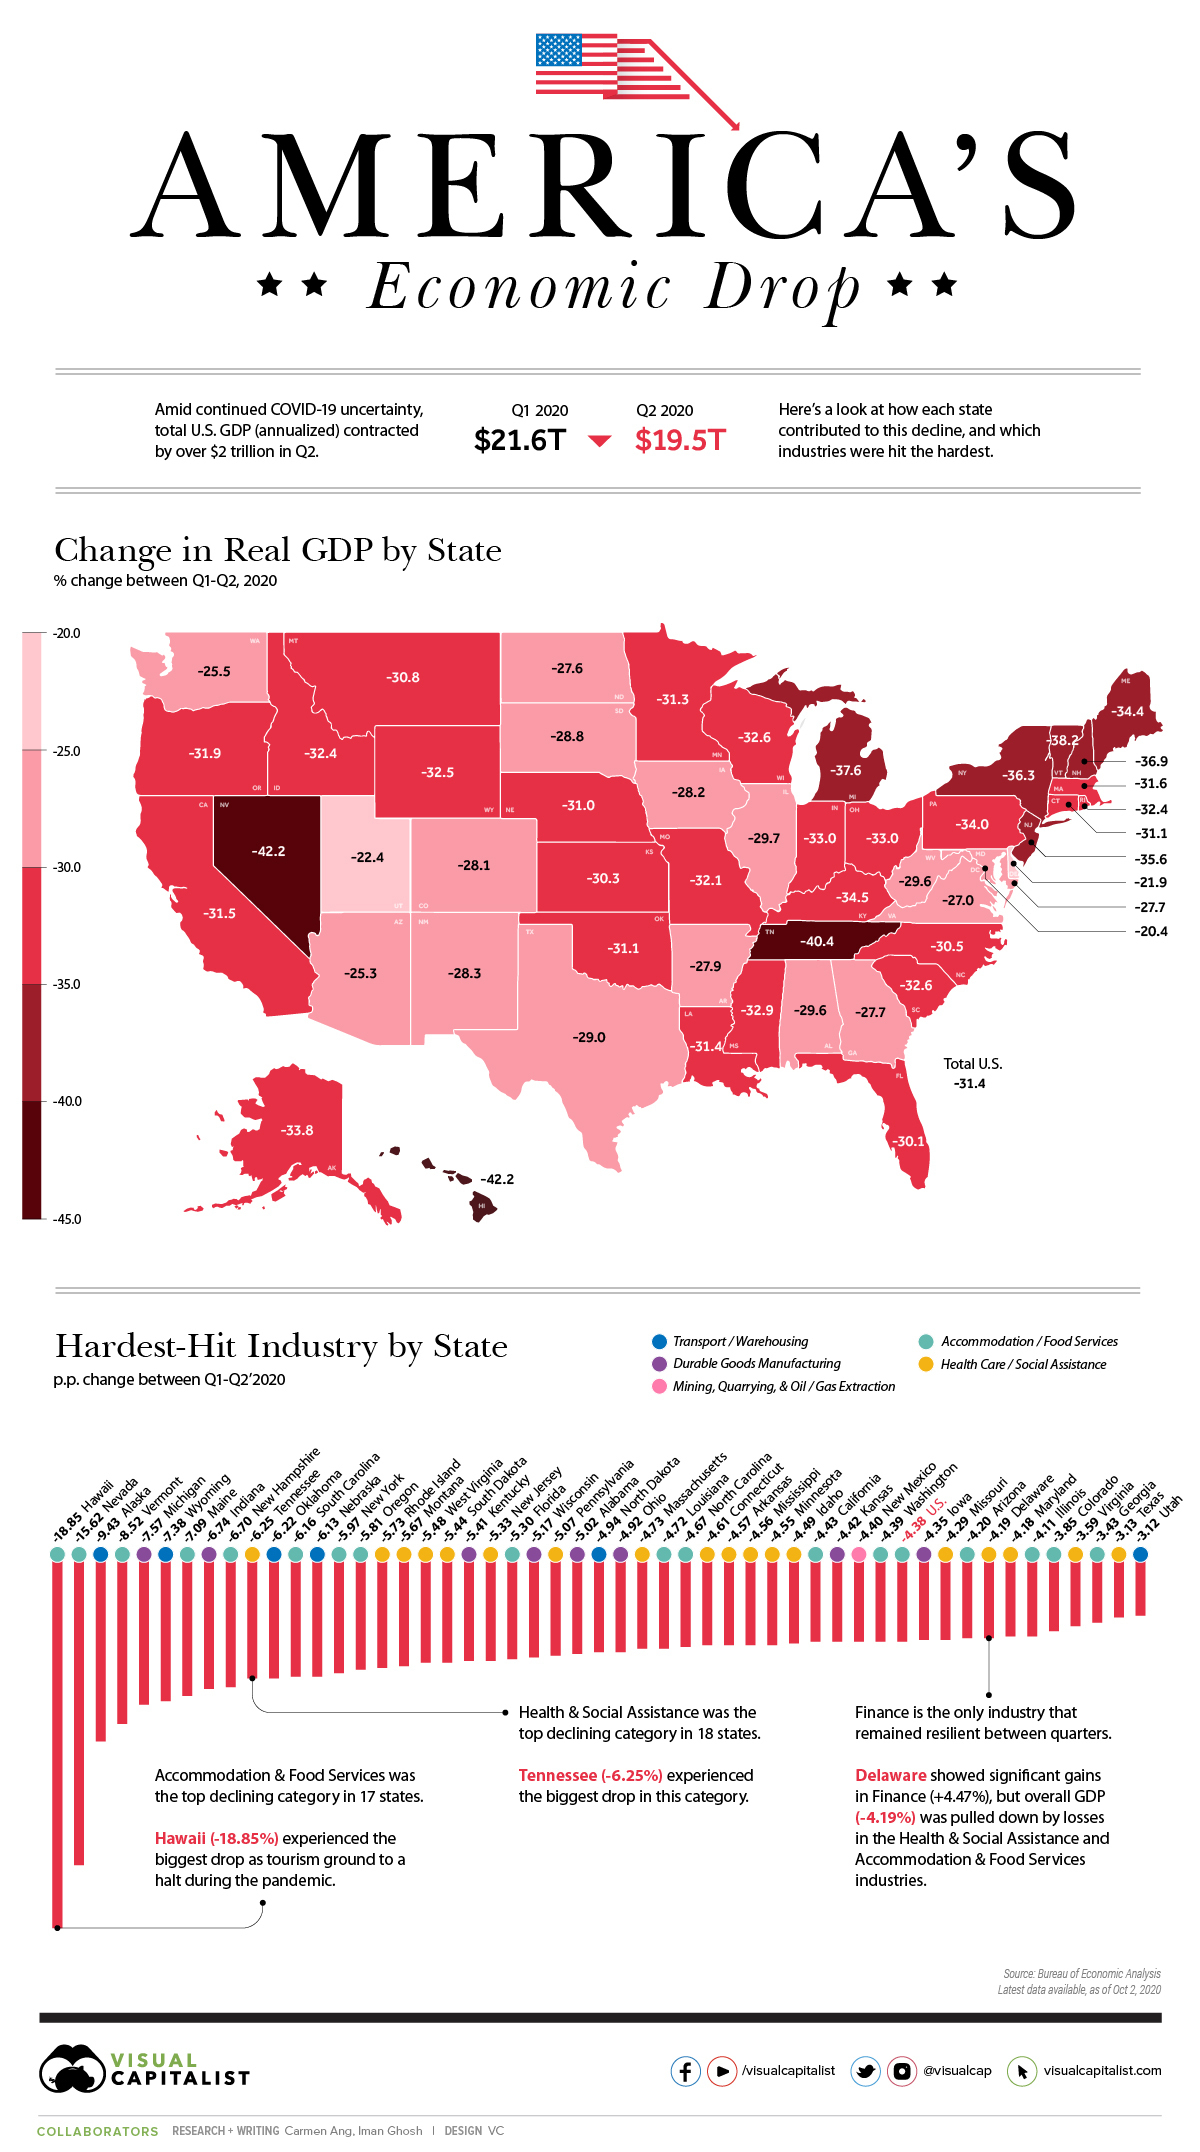
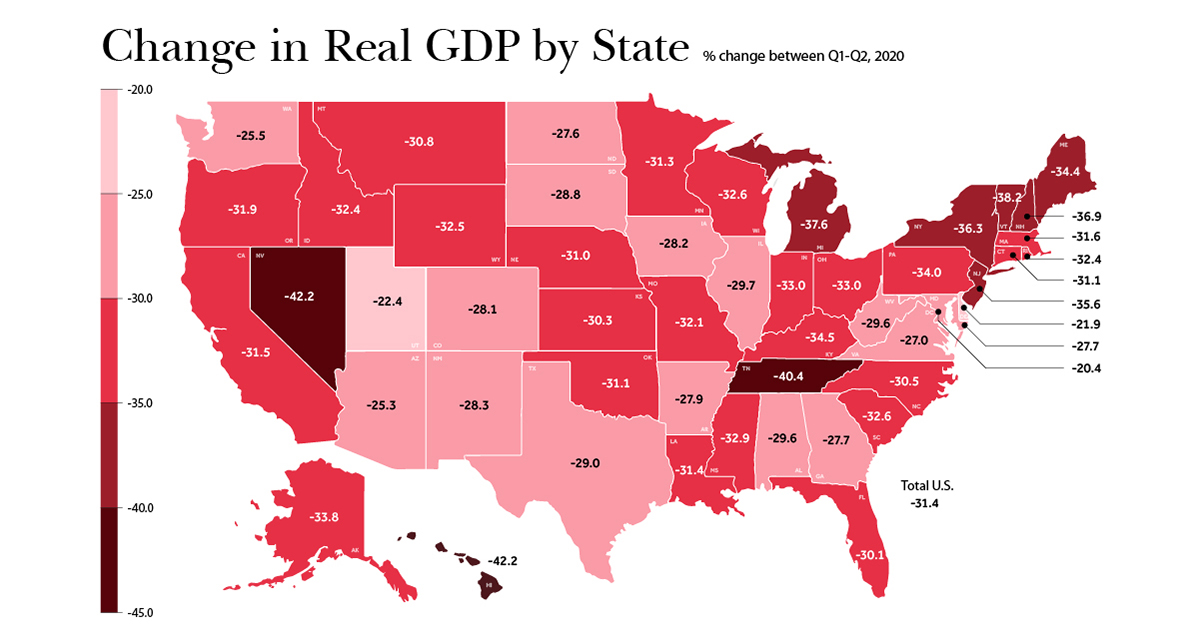
As unemployment rates hit all-time highs and businesses scrambled to stay afloat, new data shows that current dollar GDP plummeted from nearly $21.6 trillion down to $19.5 trillion between Q1’2020 and Q2’2020 (seasonally adjusted at annual rates).
While all states experienced a decline, the effects were not distributed equally across the nation. This visualization takes a look at the latest data from the Bureau of Economic Analysis, uncovering the biggest declines across states, and which industries were most affected by COVID-19 related closures and uncertainty.
Change in GDP by State and Industry
Between March-June 2020, stay-at-home orders resulted in disruptions to consumer activity, health, and the broader economy, causing U.S. GDP to fall by 31.4% from numbers posted in Q1.
The U.S. economy is the sum of its parts, with each state contributing to the total output—making the COVID-19 decline even more evident when state-by-state change in GDP is taken into consideration.
| State | Real GDP Change | Biggest Industry Decline | Industry Change (p.p.) |
|---|---|---|---|
| Alabama | -29.6 | Durable Goods Manufacturing | -5.02 |
| Alaska | -33.8 | Transport and Warehousing | -9.43 |
| Arizona | -25.3 | Accommodation and Food Services | -4.2 |
| Arkansas | -27.9 | Health Care and Social Assistance | -4.57 |
| California | -31.5 | Accommodation and Food Services | -4.43 |
| Colorado | -28.1 | Accommodation and Food Services | -3.85 |
| Connecticut | -31.1 | Health Care and Social Assistance | -4.61 |
| Delaware | -21.9 | Health Care and Social Assistance | -4.19 |
| Florida | -30.1 | Accommodation and Food Services | -5.3 |
| Georgia | -27.7 | Accommodation and Food Services | -3.43 |
| Hawaii | -42.2 | Accommodation and Food Services | -18.85 |
| Idaho | -32.4 | Health Care and Social Assistance | -4.49 |
| Illinois | -29.7 | Accommodation and Food Services | -4.11 |
| Indiana | -33.0 | Durable Goods Manufacturing | -6.74 |
| Iowa | -28.2 | Durable Goods Manufacturing | -4.35 |
| Kansas | -30.3 | Durable Goods Manufacturing | -4.42 |
| Kentucky | -34.5 | Durable Goods Manufacturing | -5.41 |
| Louisiana | -31.4 | Accommodation and Food Services | -4.72 |
| Maine | -34.4 | Accommodation and Food Services | -7.09 |
| Maryland | -27.7 | Health Care and Social Assistance | -4.18 |
| Massachusetts | -31.6 | Health Care and Social Assistance | -4.73 |
| Michigan | -37.6 | Durable Goods Manufacturing | -7.57 |
| Minnesota | -31.3 | Health Care and Social Assistance | -4.55 |
| Mississippi | -32.9 | Health Care and Social Assistance | -4.56 |
| Missouri | -32.1 | Health Care and Social Assistance | -4.29 |
| Montana | -30.8 | Health Care and Social Assistance | -5.67 |
| Nebraska | -31.0 | Transport and Warehousing | -6.13 |
| Nevada | -42.2 | Accommodation and Food Services | -15.62 |
| New Hampshire | -36.9 | Accommodation and Food Services | -6.7 |
| New Jersey | -35.6 | Health Care and Social Assistance | -5.33 |
| New Mexico | -28.3 | Mining, Quarrying, and Oil and Gas Extraction | -4.4 |
| New York | -36.3 | Accommodation and Food Services | -5.97 |
| North Carolina | -30.5 | Accommodation and Food Services | -4.67 |
| North Dakota | -27.6 | Transport and Warehousing | -4.94 |
| Ohio | -33.0 | Durable Goods Manufacturing | -4.92 |
| Oklahoma | -31.1 | Transport and Warehousing | -6.22 |
| Oregon | -31.9 | Accommodation and Food Services | -5.81 |
| Pennsylvania | -34.0 | Health Care and Social Assistance | -5.07 |
| Rhode Island | -32.4 | Health Care and Social Assistance | -5.73 |
| South Carolina | -32.6 | Accommodation and Food Services | -6.16 |
| South Dakota | -28.8 | Health Care and Social Assistance | -5.44 |
| Tennessee | -40.4 | Health Care and Social Assistance | -6.25 |
| Texas | -29.0 | Health Care and Social Assistance | -3.13 |
| Utah | -22.4 | Transport and Warehousing | -3.12 |
| Vermont | -38.2 | Accommodation and Food Services | -8.52 |
| Virginia | -27.0 | Health Care and Social Assistance | -3.59 |
| Washington | -25.5 | Accommodation and Food Services | -4.39 |
| West Virginia | -29.6 | Health Care and Social Assistance | -5.48 |
| Wisconsin | -32.6 | Durable Goods Manufacturing | -5.17 |
| Wyoming | -32.5 | Transport and Warehousing | -7.38 |
| 🇺🇸 U.S. | -31.4 | Accommodation and Food Services | -4.38 |
Note: Industry changes are reported in percentage points (p.p.) of total current dollar GDP between Q1 and Q2.
A total of 18 states took the biggest hit within the Accommodation & Food Services sector, which was also the industry that suffered the most nationally, dropping by 4.38%.
Highly dependent on tourism, Hawaii bore the brunt of decline in this industry with a 18.85% drop. According to The Economic Research Organization at the University of Hawaii (UHERO), a second wave of infections and expired financial assistance were behind this contraction.
Next, the Health Care & Social Assistance sector was most impacted in 17 states between the two quarters, falling the most in Tennessee (-6.25%).
The most resilient industry amid the pandemic was Financial Services. In the state of Delaware, home to major banks such as JPMorgan Chase and Capital One, the sector actually grew by 4.47%. However, Delaware’s GDP ultimately still fell due to contractions in other sectors.
Each Industry’s Worst Performing State
Looking at it another way, the worst-performing state by industry also becomes clear when the change in percentage points (p.p.) Q1’–Q2’2020 GDP contributions are measured. Of the 21 industries profiled, Nevada shows up in the lower end of the spectrum four times.
| Industry | Worst-performing state | Change (p.p.) |
|---|---|---|
| Agriculture, forestry, fishing and hunting | Nebraska | -4.99% |
| Mining, quarrying, and oil and gas extraction | Wyoming | -5.76% |
| Utilities | Nebraska | -0.33% |
| Construction | New York | -2.02% |
| Durable goods manufacturing | Michigan | -7.57% |
| Nondurable goods manufacturing | Indiana | -2.65% |
| Wholesale trade | New Jersey | -3.35% |
| Retail trade | Nevada | -2.88% |
| Transportation and warehousing | Alaska | -9.43% |
| Information | California | -0.88% |
| Finance and insurance | South Dakota | -1.53% |
| Real estate and rental and leasing | Florida | -2.00% |
| Professional, scientific, and technical services | District of Columbia | -4.46% |
| Management of companies and enterprises | Nevada | -0.38% |
| Administrative/ support /waste management / remediation | Nevada | -2.48% |
| Educational services | Rhode Island | -1.47% |
| Health care and social assistance | Tennessee | -6.25% |
| Arts, entertainment, and recreation | Nevada | -4.44% |
| Accommodation and food services | Hawaii | -18.85% |
| Other services (ex. govt) | District of Columbia | -2.40% |
| Government and government enterprises | Alaska | -4.19% |
With many U.S. business leaders expecting a second contraction to occur in the economy, will future figures reflect further declines, or will states manage to bounce back?


Economy
The Most Valuable Companies in Major EU Economies
From semiconductor equipment manufacturers to supercar makers, the EU’s most valuable companies run the gamut of industries.
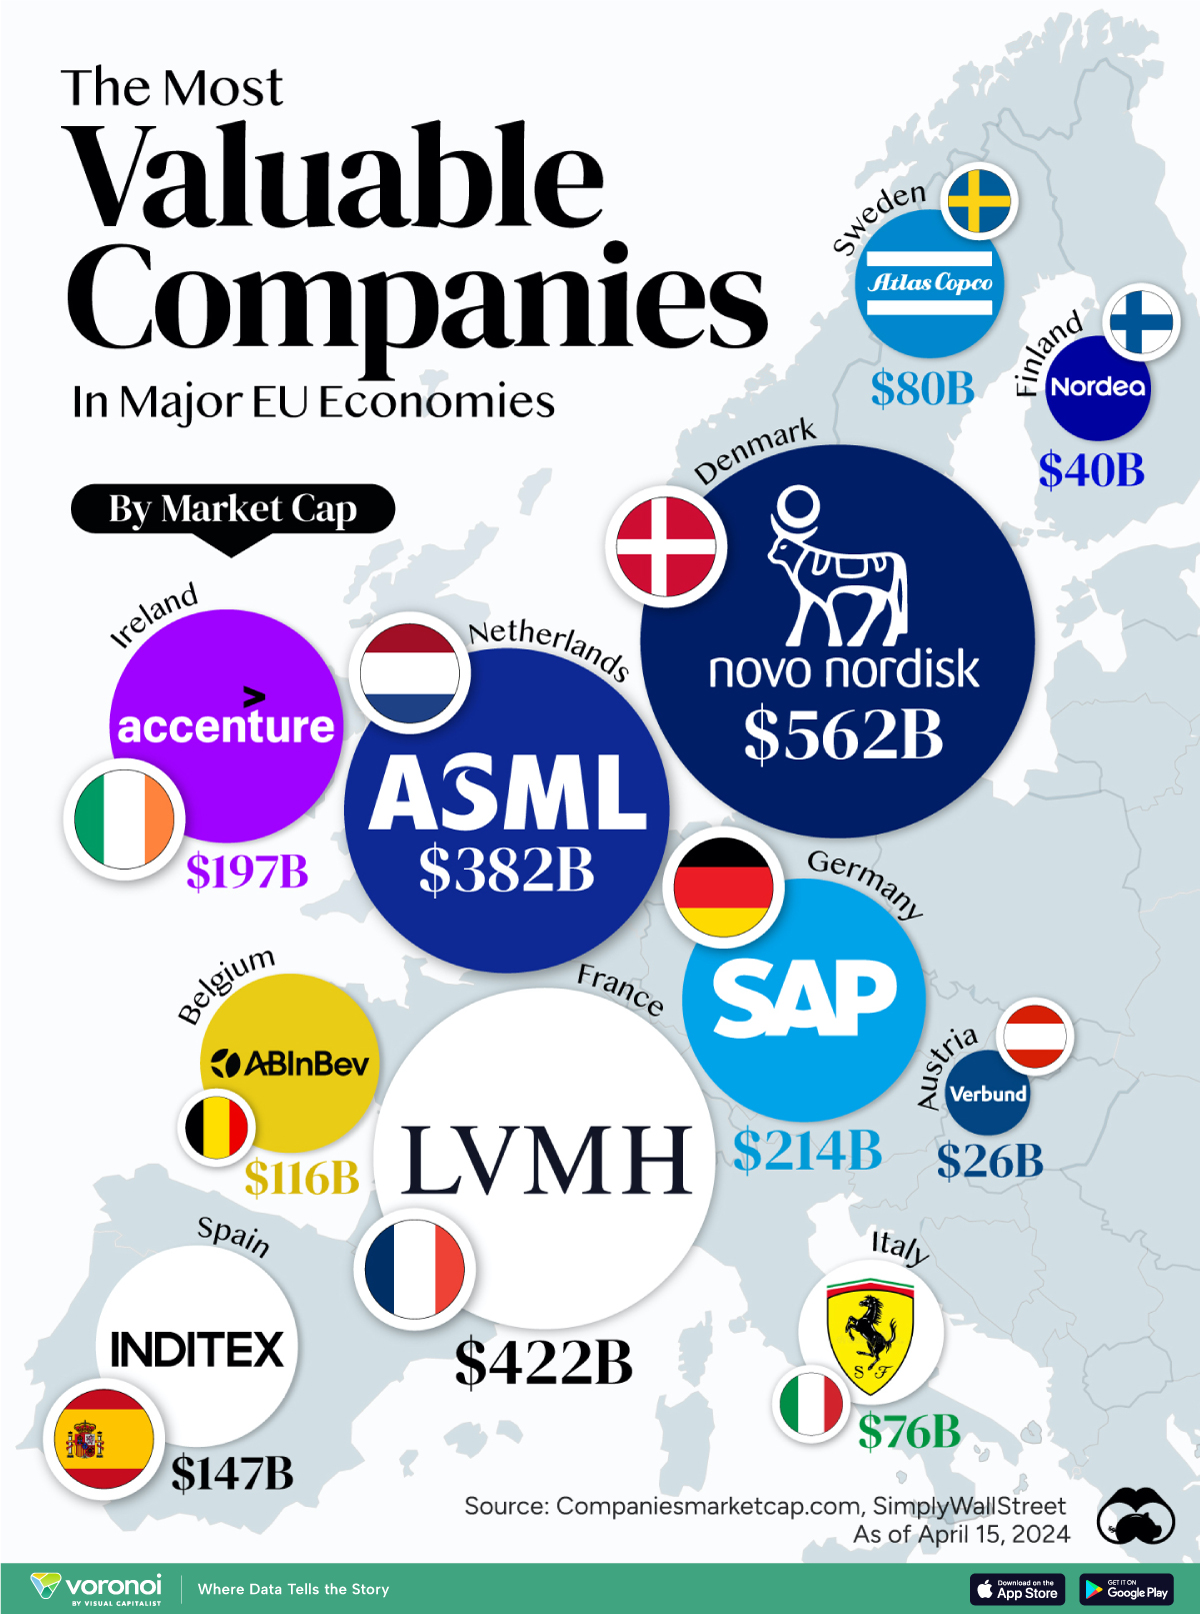
Most Valuable Companies in the EU, by Country
This was originally posted on our Voronoi app. Download the app for free on iOS or Android and discover incredible data-driven charts from a variety of trusted sources.
In this graphic, we mapped out the most valuable corporations in 11 major EU economies, based on their market capitalizations as of April 15th, 2024. All figures are in USD, and were sourced from Companiesmarketcap.com.
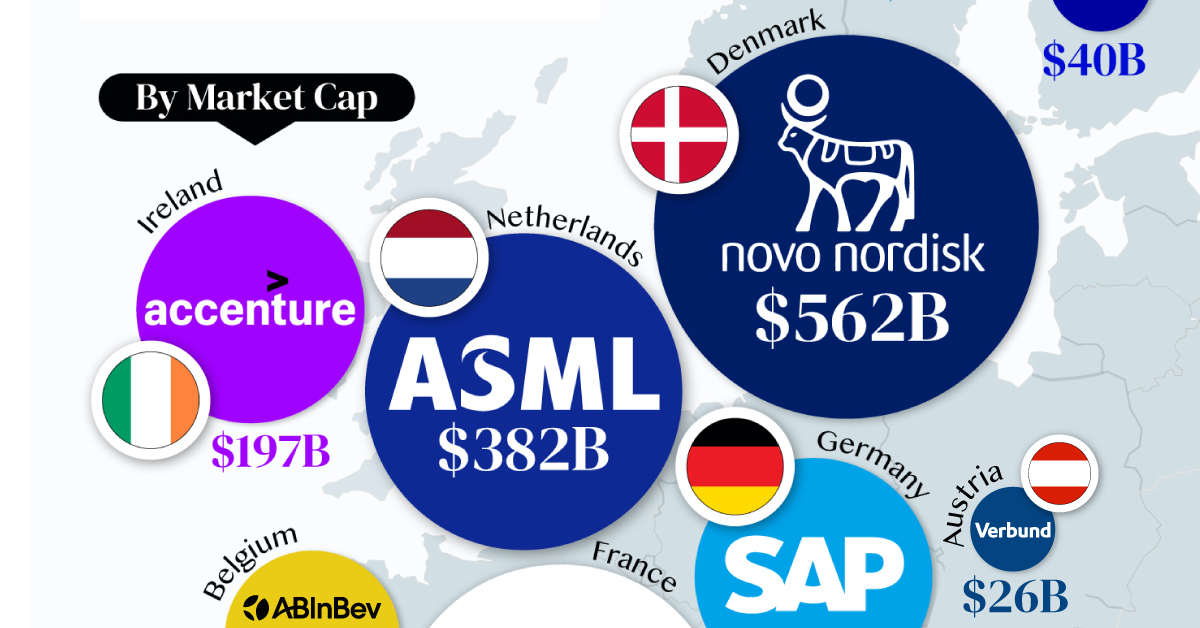
Novo Nordisk is currently worth more than $550 billion, making it Europe’s most valuable company by a wide margin. The pharmaceutical giant specializes in diabetes and weight-loss drugs. Demand for two of them, Ozempic and Wegovy, has surged due to their weight-loss capabilities, even causing nationwide shortages in the United States.
The following table includes an expanded list of the most valuable publicly-traded company in larger EU economies. Many of these were not included in the graphic due to space limitations.
| Country | Company | Sector | Market Cap |
|---|---|---|---|
| 🇩🇰 Denmark | 💊 Novo Nordisk | Pharmaceuticals | $562B |
| 🇫🇷 France | 👜 LVMH | Luxury Goods | $422B |
| 🇳🇱 Netherlands | 🔧 ASML | Semiconductor Equipment | $382B |
| 🇩🇪 Germany | 💼 SAP | Enterprise Software | $214B |
| 🇮🇪 Ireland | 🖥️ Accenture | IT Services | $197B |
| 🇪🇸 Spain | 👗 Inditex | Retail | $147B |
| 🇧🇪 Belgium | 🍻 Anheuser-Busch InBev | Beverages | $116B |
| 🇸🇪 Sweden | 🛠️ Atlas Copco | Industrial Equipment | $80B |
| 🇮🇹 Italy | 🏎️ Ferrari | Automotive | $76B |
| 🇫🇮 Finland | 🏦 Nordea Bank | Banking | $40B |
| 🇦🇹 Austria | 🔌 Verbund AG | Energy | $26B |
| 🇱🇺 Luxembourg | 🏗️ Tenaris | Oil & Gas Equipment | $22B |
| 🇨🇿 Czech Republic | 💡 CEZ Group | Energy | $20B |
| 🇵🇱 Poland | ⛽ PKN Orlen | Energy | $20B |
| 🇵🇹 Portugal | 🔌 EDP Group | Energy | $16B |
| 🇬🇷 Greece | 🏦 Eurobank | Banking | $7B |
| 🇭🇺 Hungary | ⛽ MOL Group | Energy | $7B |
| 🇭🇷 Croatia | 🏦 Zagrebacka Banka | Banking | $6B |
| 🇷🇴 Romania | ⛽ Romgaz | Energy | $4B |
| 🇸🇮 Slovenia | 💊 Krka | Pharmaceuticals | $4B |
Note: Figures are rounded and last updated on April 15th, 2024. Countries with top publicly-traded companies worth under $4 billion are excluded.
Luxury supergiant LVMH—which owns brands like Tiffany, Christian Dior, and TAG Heuer to name a few—is Europe’s second largest company by market cap, at $420 billion.
Rounding out the top three is ASML, which produces equipment crucial to chip manufacturers, worth $380 billion.
When looking at the region, there is a vast disparity between EU member states and their most valuable companies.
For example, as mentioned earlier, Denmark’s Novo Nordisk and France’s LVMH are worth between $400-550 billion each. Meanwhile, some countries don’t even have a single publicly-listed company that is worth over $1 billion.
In fact, only 12 EU countries (less than half of the union) are home to the top 100 most valuable companies within the bloc. An additional four countries are represented if you look at the list of the top 200 companies.

-

 Wealth6 days ago
Charted: Which City Has the Most Billionaires in 2024?
-

 Mining2 weeks ago
Gold vs. S&P 500: Which Has Grown More Over Five Years?
-

 Uranium2 weeks ago
The World’s Biggest Nuclear Energy Producers
-

 Education2 weeks ago
How Hard Is It to Get Into an Ivy League School?
-

 Debt2 weeks ago
How Debt-to-GDP Ratios Have Changed Since 2000
-

 Sports2 weeks ago
The Highest Earning Athletes in Seven Professional Sports
-

 Science2 weeks ago
Visualizing the Average Lifespans of Mammals
-

 Brands1 week ago
How Tech Logos Have Evolved Over Time