Markets
How Every Asset Class, Currency, and Sector Performed in 2019
Another year is in the books, and for investors 2019 was quite the turnaround story.
Despite an early backdrop of heightened volatility, escalating trade tensions, Brexit uncertainty, and calls for a recession, the year progressed in an unexpectedly pleasant fashion. The Fed used its limited arsenal to provide additional stimulus, and global markets soaked it up to extend the decade-long bull run.
By the end of 2019, every major asset class was in the black — and the S&P 500 surged to finish with its best annual return since 2013.
Markets Roundup for 2019
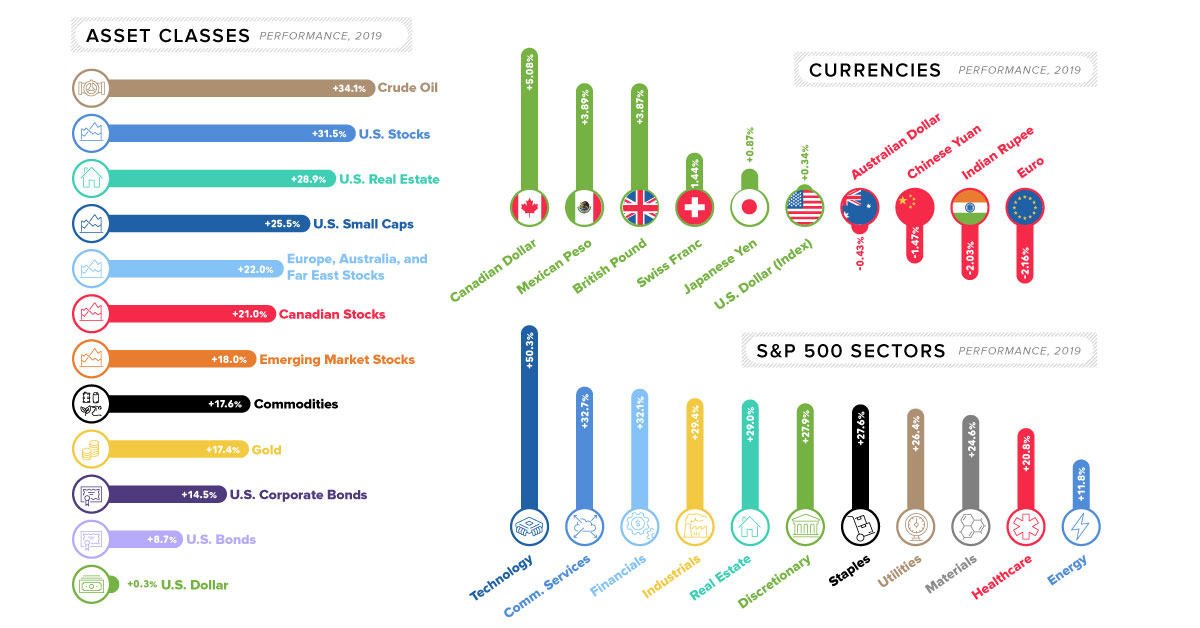
Let’s take a look at major asset classes in 2019, to see how they fared:
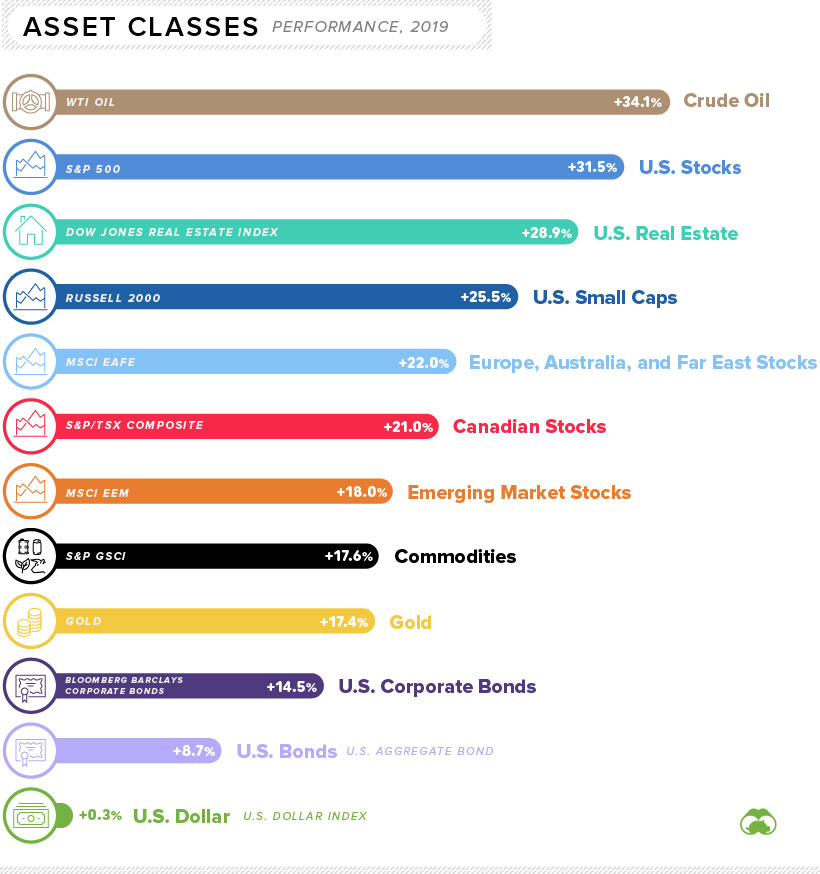
Note: all indices here (i.e. S&P 500, Russell 2000, etc.) are using total returns, with dividends re-invested.
The first thing you’ll notice when looking at the above data is that every major asset class had a positive return for the year. The only real difference lies in the magnitude of that positive return.
Even though stocks experienced some of the best gains on the year, the winning asset may be a surprising one: crude oil.
The oil price (WTI) started the year at about $46/bbl and it closed the year at over $61/bbl, good for a 34% gain. And with escalating tensions between the U.S. and Iran, energy prices could be shooting even higher in 2020.
Performance by S&P 500 Sector
Strangely enough, rising oil prices did not do enough to buoy energy stocks — the poorest performing S&P 500 sector.
Although oil was up on the year, natural gas actually fell in price by about 26% in 2019. This effectively cancels out the gains made by oil, putting energy producers at the bottom of the list:
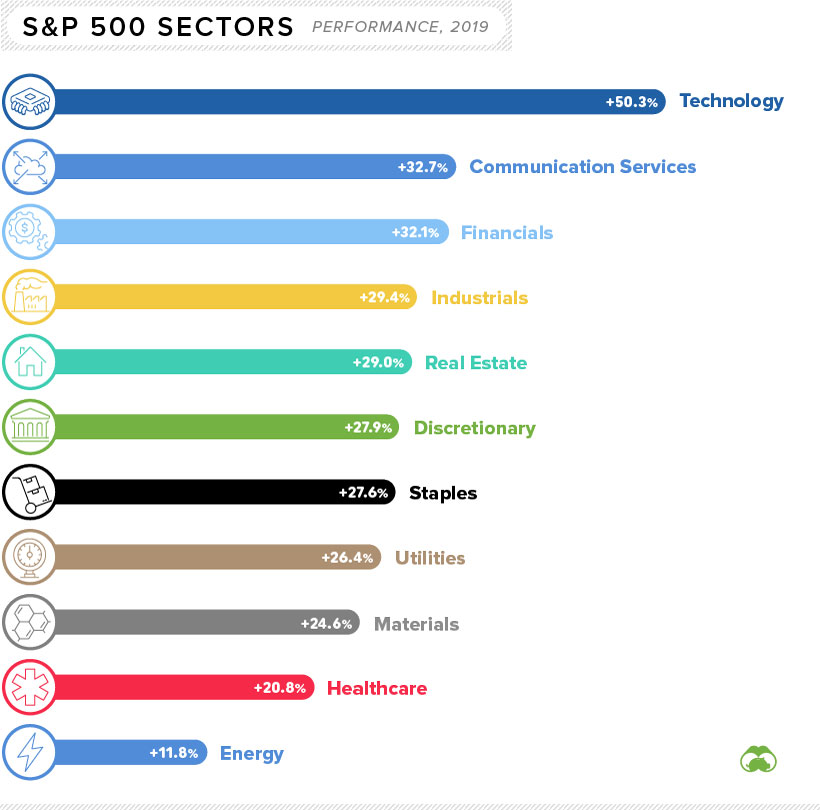
Not surprisingly, technology stocks excelled in 2019.
Tech was led by a big bounceback from Apple, a big winner that gained more than 80% over the course of the year. Other strong sectors in the benchmark U.S. index included communication services and financials.
The Currency Game
Now let’s look how currencies moved in 2019.
Below movements are all against the U.S. dollar, with the exception of the U.S. dollar itself, which is measured against a basket of currencies (U.S. Dollar Index):
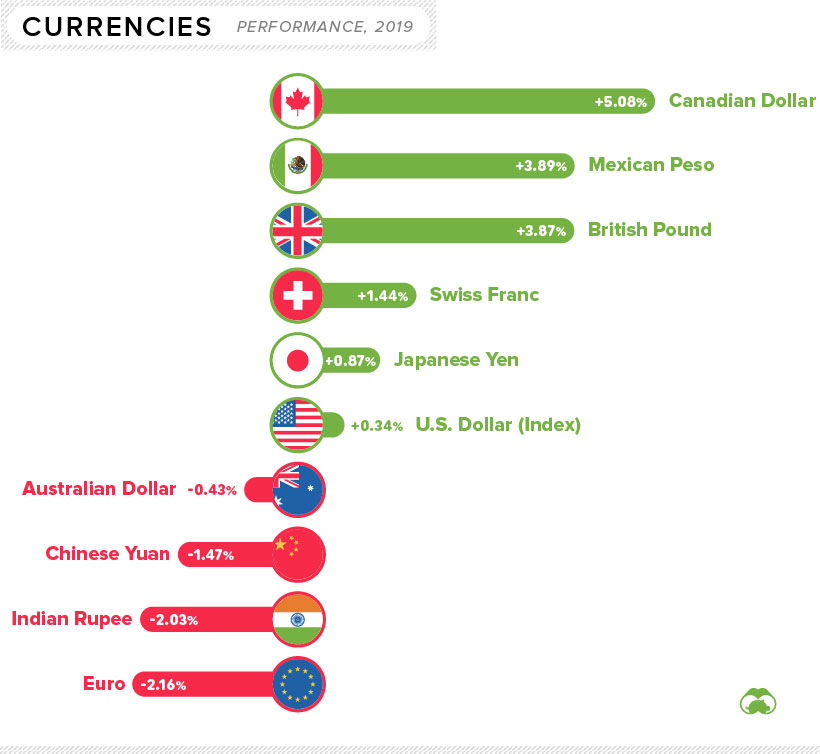
The biggest currency mover on the year was the Canadian dollar, which jumped over 5% partially thanks to rising oil prices. Meanwhile, the biggest decrease went to the euro, which fell over 2% against the U.S. dollar.
It’s also worthwhile to note that Bitcoin had a particularly strong rebound in 2019, rising over 90% against the U.S. dollar.
Winners and Losers
Finally, we’ve put together a more arbitrary list of winners and losers for the year, incorporating all of the above and more.
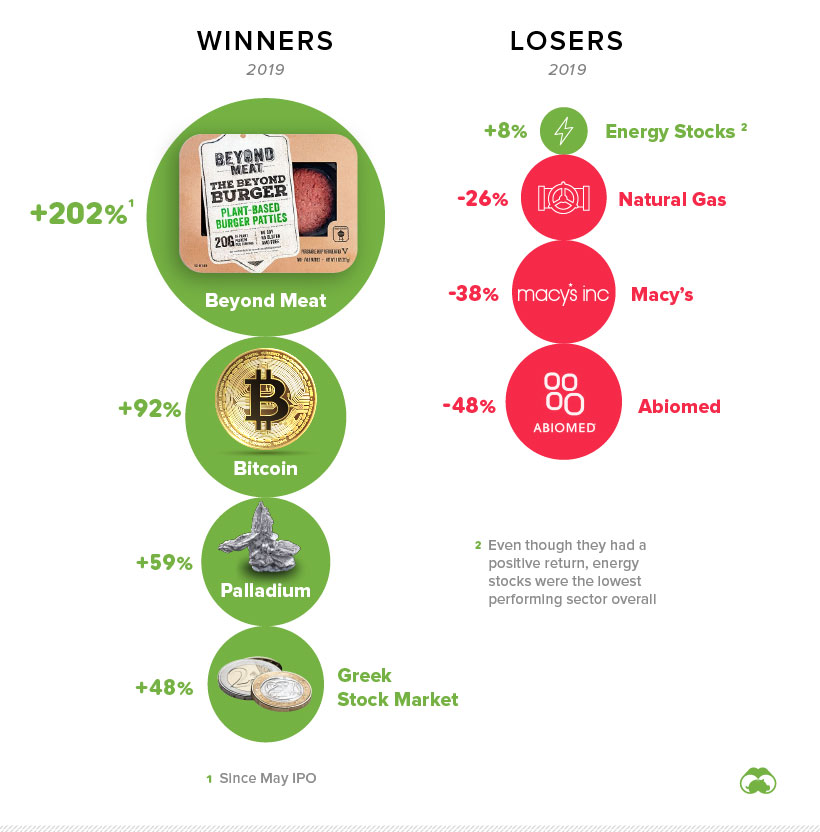
Both the Greek and Russian stock markets had banner years, each returning close to 50% in dollar terms. Faux meat brands also captured investors’ imaginations, with Beyond Meat leading the charge. Palladium was a standout commodity, gaining 59% on the year.
We’ve chosen energy stocks as a loser, since they were the poorest performing sector on the S&P 500. Meanwhile, Macy’s and Abiomed were two of the worst large cap stocks to own in 2019.


Markets
The European Stock Market: Attractive Valuations Offer Opportunities
On average, the European stock market has valuations that are nearly 50% lower than U.S. valuations. But how can you access the market?


European Stock Market: Attractive Valuations Offer Opportunities
Europe is known for some established brands, from L’Oréal to Louis Vuitton. However, the European stock market offers additional opportunities that may be lesser known.
The above infographic, sponsored by STOXX, outlines why investors may want to consider European stocks.
Attractive Valuations
Compared to most North American and Asian markets, European stocks offer lower or comparable valuations.
| Index | Price-to-Earnings Ratio | Price-to-Book Ratio |
|---|---|---|
| EURO STOXX 50 | 14.9 | 2.2 |
| STOXX Europe 600 | 14.4 | 2 |
| U.S. | 25.9 | 4.7 |
| Canada | 16.1 | 1.8 |
| Japan | 15.4 | 1.6 |
| Asia Pacific ex. China | 17.1 | 1.8 |
Data as of February 29, 2024. See graphic for full index names. Ratios based on trailing 12 month financials. The price to earnings ratio excludes companies with negative earnings.
On average, European valuations are nearly 50% lower than U.S. valuations, potentially offering an affordable entry point for investors.
Research also shows that lower price ratios have historically led to higher long-term returns.
Market Movements Not Closely Connected
Over the last decade, the European stock market had low-to-moderate correlation with North American and Asian equities.
The below chart shows correlations from February 2014 to February 2024. A value closer to zero indicates low correlation, while a value of one would indicate that two regions are moving in perfect unison.
| EURO STOXX 50 | STOXX EUROPE 600 | U.S. | Canada | Japan | Asia Pacific ex. China |
|
|---|---|---|---|---|---|---|
| EURO STOXX 50 | 1.00 | 0.97 | 0.55 | 0.67 | 0.24 | 0.43 |
| STOXX EUROPE 600 | 1.00 | 0.56 | 0.71 | 0.28 | 0.48 | |
| U.S. | 1.00 | 0.73 | 0.12 | 0.25 | ||
| Canada | 1.00 | 0.22 | 0.40 | |||
| Japan | 1.00 | 0.88 | ||||
| Asia Pacific ex. China | 1.00 |
Data is based on daily USD returns.
European equities had relatively independent market movements from North American and Asian markets. One contributing factor could be the differing sector weights in each market. For instance, technology makes up a quarter of the U.S. market, but health care and industrials dominate the broader European market.
Ultimately, European equities can enhance portfolio diversification and have the potential to mitigate risk for investors.
Tracking the Market
For investors interested in European equities, STOXX offers a variety of flagship indices:
| Index | Description | Market Cap |
|---|---|---|
| STOXX Europe 600 | Pan-regional, broad market | €10.5T |
| STOXX Developed Europe | Pan-regional, broad-market | €9.9T |
| STOXX Europe 600 ESG-X | Pan-regional, broad market, sustainability focus | €9.7T |
| STOXX Europe 50 | Pan-regional, blue-chip | €5.1T |
| EURO STOXX 50 | Eurozone, blue-chip | €3.5T |
Data is as of February 29, 2024. Market cap is free float, which represents the shares that are readily available for public trading on stock exchanges.
The EURO STOXX 50 tracks the Eurozone’s biggest and most traded companies. It also underlies one of the world’s largest ranges of ETFs and mutual funds. As of November 2023, there were €27.3 billion in ETFs and €23.5B in mutual fund assets under management tracking the index.
“For the past 25 years, the EURO STOXX 50 has served as an accurate, reliable and tradable representation of the Eurozone equity market.”
— Axel Lomholt, General Manager at STOXX
Partnering with STOXX to Track the European Stock Market
Are you interested in European equities? STOXX can be a valuable partner:
- Comprehensive, liquid and investable ecosystem
- European heritage, global reach
- Highly sophisticated customization capabilities
- Open architecture approach to using data
- Close partnerships with clients
- Part of ISS STOXX and Deutsche Börse Group
With a full suite of indices, STOXX can help you benchmark against the European stock market.
Learn how STOXX’s European indices offer liquid and effective market access.

-

 Economy2 days ago
Economic Growth Forecasts for G7 and BRICS Countries in 2024
The IMF has released its economic growth forecasts for 2024. How do the G7 and BRICS countries compare?
-

 Markets1 week ago
U.S. Debt Interest Payments Reach $1 Trillion
U.S. debt interest payments have surged past the $1 trillion dollar mark, amid high interest rates and an ever-expanding debt burden.
-

 United States2 weeks ago
Ranked: The Largest U.S. Corporations by Number of Employees
We visualized the top U.S. companies by employees, revealing the massive scale of retailers like Walmart, Target, and Home Depot.
-

 Markets2 weeks ago
The Top 10 States by Real GDP Growth in 2023
This graphic shows the states with the highest real GDP growth rate in 2023, largely propelled by the oil and gas boom.
-

 Markets2 weeks ago
Ranked: The World’s Top Flight Routes, by Revenue
In this graphic, we show the highest earning flight routes globally as air travel continued to rebound in 2023.
-

 Markets2 weeks ago
Ranked: The Most Valuable Housing Markets in America
The U.S. residential real estate market is worth a staggering $47.5 trillion. Here are the most valuable housing markets in the country.

-

 Energy1 week ago
The World’s Biggest Nuclear Energy Producers
-

 Money2 weeks ago
Which States Have the Highest Minimum Wage in America?
-

 Technology2 weeks ago
Ranked: Semiconductor Companies by Industry Revenue Share
-
Markets2 weeks ago
Ranked: The World’s Top Flight Routes, by Revenue
-

 Countries2 weeks ago
Population Projections: The World’s 6 Largest Countries in 2075
-
Markets2 weeks ago
The Top 10 States by Real GDP Growth in 2023
-

 Demographics2 weeks ago
The Smallest Gender Wage Gaps in OECD Countries
-

 United States2 weeks ago
Where U.S. Inflation Hit the Hardest in March 2024