Markets
Currency Wars: The Maple Syrup Edition [Chart]
![Currency Wars: The Maple Syrup Edition [Chart]](https://www.visualcapitalist.com/wp-content/uploads/2015/07/currency-wars-maple-syrup-edition-chart.jpg)
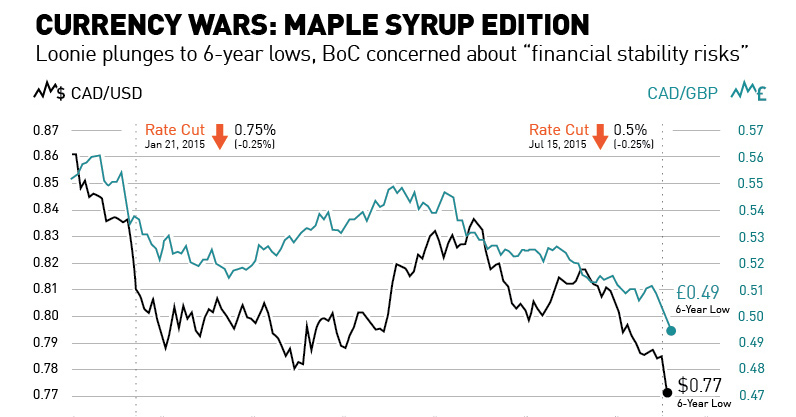
Currency Wars: The Maple Syrup Edition [Chart]
Loonie plunges to 6-year lows, BoC concerned about “financial stability risks”
The Chart of the Week is a weekly feature in Visual Capitalist on Fridays.
Global monetary policy these days is a fast moving stream. It’s far easier to paddle along with the current and simply hope that there are no waterfalls or sharp rocks further down the way.
That’s why two days ago, the Bank of Canada decided to cut its overnight rate for the second time in the last six months. Rates now stand at 0.5%, and the the last time they were this low was during an emergency one-year stretch at the tail end of the Great Recession.
The Canadian dollar reacted as expected. The currency had gotten thoroughly crushed in trading since the beginning of the year, and the hammering didn’t stop after the rate announcement. It accelerated, putting the Canadian dollar at six-year lows in terms of dollars and pounds. It’s now down -10.2% to the US dollar and -10.4% to the pound sterling year-to-date. Somehow the loonie even managed to lose ground (-0.72%) to the euro, which is currently in the middle of a historic crisis.
All is Fair in Love and War
Even though it is knowingly participating in an ongoing currency war, Canada doesn’t really have a reputation for being a particularly aggressive nation. Heck, Prime Minister Stephen Harper has even been compared to “Jesus” for his saintly efforts in pushing through draconian terror legislation.
So why the rate cuts and competitive devaluation? The problem is that it is a “Prisoner’s Dilemma” from a global macro perspective: when every other country is either creating money out of thin air, cutting rates, using monetary stimulus, or borrowing extra debt, it makes it extremely difficult to go against the grain. Imagine playing the board game Monopoly in which other players amend the rules so they can take money straight from the bank. If you don’t follow suit, you’re going to lose.
It’s not that countries like Canada want to be in a currency war of competitive devaluation. These rate decisions always seem like a good idea in isolation because the situation always forces the central bank’s hand. We don’t blame the Bank of Canada for the decision itself – it is simply the inevitable result of loose and ineffective monetary policy worldwide that is spiraling out of control.
The gamble of this vicious cycle has been that global growth would resume and the status quo could be pieced back together. Instead, Canada finds itself in the middle of a technical recession with two consecutive quarters of negative growth, crashing commodity prices, an iffy recovery for the United States, and the eurozone held together by a thread.
Against that backdrop, there’s only one thing to do: cut rates again!
“Financial Stability Risks”
There are some interesting side effects that bubble to the top during all of this rate-cutting business. Forget the effects worldwide – to see the results of this policy, one only needs to look domestically within Canada. Even despite the Canadian economy treading water as of late, there are two concerning metrics that have been peaking.
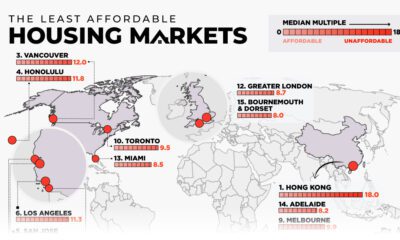
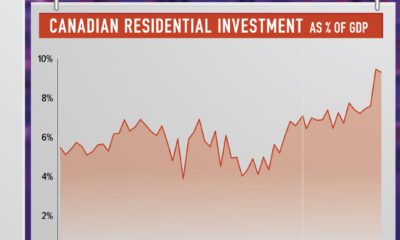
Firstly, the Canadian housing market is the most overvalued in the world. Even last month, it continued to set records on the back of Chinese buying, with Vancouver closing 29.1% more sales in June than the 10-year average. In Toronto, luxury market sales have sailed 56% over the first six months of the year. This is what happens when the cost of money is zero.
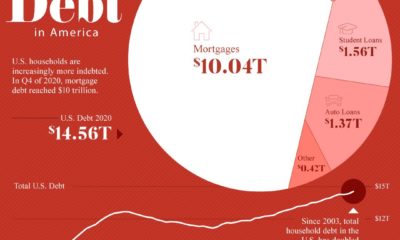
Second, household debt for Canadians has reached an alarming 163.3% of disposable income. Since 2007, it is estimated that only Greece has grown its household debt more than Canada. Further, a recent report by BMO says that Canadian households carry an average of $92,699 in debt, and pay $1,165 each month to service it. In the poll, respondents said that if interest rates were raised two percentage points, that 64% of them would feel “stressed” servicing their debt. One quarter of respondents would feel “very stressed” if that happened. A two percent increase at the time of the poll would have brought the benchmark interest rate to 2.75%, which is basically the lowest it ever bottomed at in the ’80s and ’90s.
Stephen Poloz, the Governor of the Bank of Canada, is aware of these concerns. “Financial stability risks remain elevated,” Governor Stephen Poloz told reporters on the day of the rate cuts. “Of particular note are the vulnerabilities associated with household debt and rising housing prices. And we must acknowledge that today’s action could exacerbate these vulnerabilities.”
Paddle away, Mr. Poloz. Let’s hope there’s no rocky spots downstream that could capsize the boat.


Markets
The European Stock Market: Attractive Valuations Offer Opportunities
On average, the European stock market has valuations that are nearly 50% lower than U.S. valuations. But how can you access the market?


European Stock Market: Attractive Valuations Offer Opportunities
Europe is known for some established brands, from L’Oréal to Louis Vuitton. However, the European stock market offers additional opportunities that may be lesser known.
The above infographic, sponsored by STOXX, outlines why investors may want to consider European stocks.
Attractive Valuations
Compared to most North American and Asian markets, European stocks offer lower or comparable valuations.
| Index | Price-to-Earnings Ratio | Price-to-Book Ratio |
|---|---|---|
| EURO STOXX 50 | 14.9 | 2.2 |
| STOXX Europe 600 | 14.4 | 2 |
| U.S. | 25.9 | 4.7 |
| Canada | 16.1 | 1.8 |
| Japan | 15.4 | 1.6 |
| Asia Pacific ex. China | 17.1 | 1.8 |
Data as of February 29, 2024. See graphic for full index names. Ratios based on trailing 12 month financials. The price to earnings ratio excludes companies with negative earnings.
On average, European valuations are nearly 50% lower than U.S. valuations, potentially offering an affordable entry point for investors.
Research also shows that lower price ratios have historically led to higher long-term returns.
Market Movements Not Closely Connected
Over the last decade, the European stock market had low-to-moderate correlation with North American and Asian equities.
The below chart shows correlations from February 2014 to February 2024. A value closer to zero indicates low correlation, while a value of one would indicate that two regions are moving in perfect unison.
| EURO STOXX 50 | STOXX EUROPE 600 | U.S. | Canada | Japan | Asia Pacific ex. China |
|
|---|---|---|---|---|---|---|
| EURO STOXX 50 | 1.00 | 0.97 | 0.55 | 0.67 | 0.24 | 0.43 |
| STOXX EUROPE 600 | 1.00 | 0.56 | 0.71 | 0.28 | 0.48 | |
| U.S. | 1.00 | 0.73 | 0.12 | 0.25 | ||
| Canada | 1.00 | 0.22 | 0.40 | |||
| Japan | 1.00 | 0.88 | ||||
| Asia Pacific ex. China | 1.00 |
Data is based on daily USD returns.
European equities had relatively independent market movements from North American and Asian markets. One contributing factor could be the differing sector weights in each market. For instance, technology makes up a quarter of the U.S. market, but health care and industrials dominate the broader European market.
Ultimately, European equities can enhance portfolio diversification and have the potential to mitigate risk for investors.
Tracking the Market
For investors interested in European equities, STOXX offers a variety of flagship indices:
| Index | Description | Market Cap |
|---|---|---|
| STOXX Europe 600 | Pan-regional, broad market | €10.5T |
| STOXX Developed Europe | Pan-regional, broad-market | €9.9T |
| STOXX Europe 600 ESG-X | Pan-regional, broad market, sustainability focus | €9.7T |
| STOXX Europe 50 | Pan-regional, blue-chip | €5.1T |
| EURO STOXX 50 | Eurozone, blue-chip | €3.5T |
Data is as of February 29, 2024. Market cap is free float, which represents the shares that are readily available for public trading on stock exchanges.
The EURO STOXX 50 tracks the Eurozone’s biggest and most traded companies. It also underlies one of the world’s largest ranges of ETFs and mutual funds. As of November 2023, there were €27.3 billion in ETFs and €23.5B in mutual fund assets under management tracking the index.
“For the past 25 years, the EURO STOXX 50 has served as an accurate, reliable and tradable representation of the Eurozone equity market.”
— Axel Lomholt, General Manager at STOXX
Partnering with STOXX to Track the European Stock Market
Are you interested in European equities? STOXX can be a valuable partner:
- Comprehensive, liquid and investable ecosystem
- European heritage, global reach
- Highly sophisticated customization capabilities
- Open architecture approach to using data
- Close partnerships with clients
- Part of ISS STOXX and Deutsche Börse Group
With a full suite of indices, STOXX can help you benchmark against the European stock market.
Learn how STOXX’s European indices offer liquid and effective market access.

-

 Economy2 days ago
Economic Growth Forecasts for G7 and BRICS Countries in 2024
The IMF has released its economic growth forecasts for 2024. How do the G7 and BRICS countries compare?
-

 Markets1 week ago
U.S. Debt Interest Payments Reach $1 Trillion
U.S. debt interest payments have surged past the $1 trillion dollar mark, amid high interest rates and an ever-expanding debt burden.
-

 United States2 weeks ago
Ranked: The Largest U.S. Corporations by Number of Employees
We visualized the top U.S. companies by employees, revealing the massive scale of retailers like Walmart, Target, and Home Depot.
-

 Markets2 weeks ago
The Top 10 States by Real GDP Growth in 2023
This graphic shows the states with the highest real GDP growth rate in 2023, largely propelled by the oil and gas boom.
-

 Markets2 weeks ago
Ranked: The World’s Top Flight Routes, by Revenue
In this graphic, we show the highest earning flight routes globally as air travel continued to rebound in 2023.
-

 Markets3 weeks ago
Ranked: The Most Valuable Housing Markets in America
The U.S. residential real estate market is worth a staggering $47.5 trillion. Here are the most valuable housing markets in the country.


-

 Education1 week ago
How Hard Is It to Get Into an Ivy League School?
-

 Technology2 weeks ago
Ranked: Semiconductor Companies by Industry Revenue Share
-
Markets2 weeks ago
Ranked: The World’s Top Flight Routes, by Revenue
-

 Demographics2 weeks ago
Population Projections: The World’s 6 Largest Countries in 2075
-
Markets2 weeks ago
The Top 10 States by Real GDP Growth in 2023
-

 Demographics2 weeks ago
The Smallest Gender Wage Gaps in OECD Countries
-

 Economy2 weeks ago
Where U.S. Inflation Hit the Hardest in March 2024
-

 Green2 weeks ago
Top Countries By Forest Growth Since 2001