Markets
Trading Places: Chinese Flee Stocks for Offshore Property [Chart]
![Trading Places: Chinese Flee Stocks for Offshore Property [Chart]](https://www.visualcapitalist.com/wp-content/uploads/2015/07/chart-chinese-foreign-property-ownership.jpg)
Trading Places: Chinese Flee Stocks for Offshore Property [Chart]
Canadian and Australian housing sales set new monthly records in June
The Chart of the Week is a weekly feature in Visual Capitalist on Fridays.
Every transitioning economy has its growing pains.
This turns out to be especially true when that economy is an unusual Jekyll-Hyde type of hybrid: it’s run by a communist government that favours control, but at the same time wants to harness the growth of free market dynamics.
Over the last two years, the Chinese government has worked to relax margin restrictions. By changing these rules, it would allow more regular folks to borrow on margin to buy into and fuel the stock market. The only problem was that most of the public had never invested before, and intense speculative buying replaced any disciplined search for value or growth.
The market soared to new heights. New investors saw the gains and just kept piling in. Between June 2014 and May 2015, more than 40 million new trading accounts were opened, and many of these new equity investors had less than a high school education.
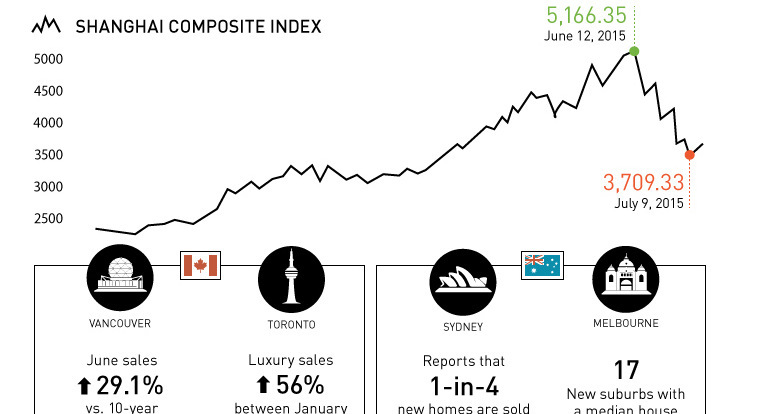
The Shanghai Composite Index, which tracks shares traded on Shanghai’s stock exchange, climbed over 150% since late 2014.
Then, the party abruptly came to an end. Over the last month, the market crashed and lost about 30% of its value, worth about $3 trillion. The government had taken unprecedented steps to slow down the crash, including halting IPOs, cutting interest rates, and other “stability measures”. Top brokerages even pledged to collectively buy 120 billion yuan ($24 billion) of shares to steady the market. Finally, the China Securities Regulatory Commission banned sales of shares for major investors for six months, and suspended trading in over 1,000 stocks.
The once frothy market has had mixed reactions over the last few days, but remains near its three month low.
The Pacific Connection
While surely some people have lost faith in Chinese stocks as of late, that doesn’t mean money wasn’t made. The market is still up 80% from a year ago and many that were in early made a killing.
What are some of these people doing with their newfound capital? Many are buying real estate in China to store their wealth.
In a survey carried out by the Southwestern University of Finance and Economics in Chengdu, 28,140 respondents were polled between June 15 and July 2. They found that more people were taking money from the stock market and buying property. In Q2, 3.7% of stock investors bought housing compared to 2.3% in the first quarter. Of those that bought property, 70% of households have made money in the stock market.
People from China have also looked abroad to store their wealth in housing. It’s no secret that Canada, Australia, and the United States have all felt the effects of foreign buying in their property markets over the years.
Cities such as Vancouver and Toronto have had an influx of new buyers fueling the boom, and this is part of the reason why Canada is now considered to have the most overvalued housing market in the world.
Sydney and Melbourne have seen similar effects, and Australia was recently ranked by the Economist as the second most overvalued housing market relative to income.
In the United States, the Bay Area continues to also have a bull market in property. Technology plays a big role in this, but foreign buyers have also been helping drive prices there as well. California is a popular destination for Chinese buyers, as 30% of all Asian-Americans reside in the Golden State.
The Numbers
In the month of June, housing prices and the number of sales have reached record levels in some of these markets.
The two hottest Canadian markets remained on fire, despite the country edging into a technical recession. In Vancouver, housing sales were 29.1% higher than the 10-year average for the month of June. This brought the benchmark housing price to C$1.1 million for a detached home. June was the fourth straight month with over 4,000 sales, a new record for the city. Luxury sales rose 48% in the period between January and June compared to last year.
Toronto’s luxury market is even hotter, with sales increasing 56% over the first half of the year. The benchmark housing price in the city for a detached home is now C$1.05 million, a 14.2% increase over the last year.
Two of the more prominent markets in Australia also kept their momentum. In Sydney, prices have soared 22.0% over the last 12 months for homes, to a median price of A$900,000. Melbourne, which started to cool off in the beginning of 2015, found resurgence in June that brought it back to strong double-digit annual growth.
Melbourne, which typically has less expensive homes than Sydney, Vancouver, and Toronto, is starting to join the million dollar club as well. Recently, there are 17 new postal codes that now have homes with A$1 million median prices.
From the Front Lines
The million dollar question is: to what extent do exits from the Chinese stock market and capital flight influence the markets in the above cities. Everyone can agree there is some influence, but narrowing down the specifics is much more difficult.
This is because there are not many official records on the specifics of foreign ownership, and much of the time transactions are done indirectly through family and friends.
Aside from the correlation with the numbers above, there is mainly anecdotal evidence from people on the ground.
In Vancouver, for instance, a Reuters survey found that of 50 land titles for detached Vancouver Westside homes worth over C$2 million, that nearly half of purchasers had surnames typical of mainland China. Five real estate agents primarily focused on sales on Vancouver’s more luxurious west side estimated that between 50% and 80% of their clients had ties to mainland China.
Michael Pallier, the Principal at Sydney Sothebys International Realty, said recently that volatility in the Chinese market was prompting more interest in local properties in the luxury market.
“Last month in our office we sold 20 properties for $115 million turnover in June, of which 25 per cent were sold to Chinese buyers, so we do have a lot of experience dealing with Chinese markets,” said Mr. Pallier, “They’d rather put the money into a property than put it into cash or into shares.”
David Fung, the vice-chair of the Canada China Business council, said that the stock market crash and volatility drives more investments into Canada, including British Columbia’s hot property market.
“They’re not looking necessarily for a very high return because it is for their own insurance,” said Fung.


Markets
U.S. Debt Interest Payments Reach $1 Trillion
U.S. debt interest payments have surged past the $1 trillion dollar mark, amid high interest rates and an ever-expanding debt burden.


U.S. Debt Interest Payments Reach $1 Trillion
This was originally posted on our Voronoi app. Download the app for free on iOS or Android and discover incredible data-driven charts from a variety of trusted sources.
The cost of paying for America’s national debt crossed the $1 trillion dollar mark in 2023, driven by high interest rates and a record $34 trillion mountain of debt.
Over the last decade, U.S. debt interest payments have more than doubled amid vast government spending during the pandemic crisis. As debt payments continue to soar, the Congressional Budget Office (CBO) reported that debt servicing costs surpassed defense spending for the first time ever this year.
This graphic shows the sharp rise in U.S. debt payments, based on data from the Federal Reserve.
A $1 Trillion Interest Bill, and Growing
Below, we show how U.S. debt interest payments have risen at a faster pace than at another time in modern history:
| Date | Interest Payments | U.S. National Debt |
|---|---|---|
| 2023 | $1.0T | $34.0T |
| 2022 | $830B | $31.4T |
| 2021 | $612B | $29.6T |
| 2020 | $518B | $27.7T |
| 2019 | $564B | $23.2T |
| 2018 | $571B | $22.0T |
| 2017 | $493B | $20.5T |
| 2016 | $460B | $20.0T |
| 2015 | $435B | $18.9T |
| 2014 | $442B | $18.1T |
| 2013 | $425B | $17.2T |
| 2012 | $417B | $16.4T |
| 2011 | $433B | $15.2T |
| 2010 | $400B | $14.0T |
| 2009 | $354B | $12.3T |
| 2008 | $380B | $10.7T |
| 2007 | $414B | $9.2T |
| 2006 | $387B | $8.7T |
| 2005 | $355B | $8.2T |
| 2004 | $318B | $7.6T |
| 2003 | $294B | $7.0T |
| 2002 | $298B | $6.4T |
| 2001 | $318B | $5.9T |
| 2000 | $353B | $5.7T |
| 1999 | $353B | $5.8T |
| 1998 | $360B | $5.6T |
| 1997 | $368B | $5.5T |
| 1996 | $362B | $5.3T |
| 1995 | $357B | $5.0T |
| 1994 | $334B | $4.8T |
| 1993 | $311B | $4.5T |
| 1992 | $306B | $4.2T |
| 1991 | $308B | $3.8T |
| 1990 | $298B | $3.4T |
| 1989 | $275B | $3.0T |
| 1988 | $254B | $2.7T |
| 1987 | $240B | $2.4T |
| 1986 | $225B | $2.2T |
| 1985 | $219B | $1.9T |
| 1984 | $205B | $1.7T |
| 1983 | $176B | $1.4T |
| 1982 | $157B | $1.2T |
| 1981 | $142B | $1.0T |
| 1980 | $113B | $930.2B |
| 1979 | $96B | $845.1B |
| 1978 | $84B | $789.2B |
| 1977 | $69B | $718.9B |
| 1976 | $61B | $653.5B |
| 1975 | $55B | $576.6B |
| 1974 | $50B | $492.7B |
| 1973 | $45B | $469.1B |
| 1972 | $39B | $448.5B |
| 1971 | $36B | $424.1B |
| 1970 | $35B | $389.2B |
| 1969 | $30B | $368.2B |
| 1968 | $25B | $358.0B |
| 1967 | $23B | $344.7B |
| 1966 | $21B | $329.3B |
Interest payments represent seasonally adjusted annual rate at the end of Q4.
At current rates, the U.S. national debt is growing by a remarkable $1 trillion about every 100 days, equal to roughly $3.6 trillion per year.
As the national debt has ballooned, debt payments even exceeded Medicaid outlays in 2023—one of the government’s largest expenditures. On average, the U.S. spent more than $2 billion per day on interest costs last year. Going further, the U.S. government is projected to spend a historic $12.4 trillion on interest payments over the next decade, averaging about $37,100 per American.
Exacerbating matters is that the U.S. is running a steep deficit, which stood at $1.1 trillion for the first six months of fiscal 2024. This has accelerated due to the 43% increase in debt servicing costs along with a $31 billion dollar increase in defense spending from a year earlier. Additionally, a $30 billion increase in funding for the Federal Deposit Insurance Corporation in light of the regional banking crisis last year was a major contributor to the deficit increase.
Overall, the CBO forecasts that roughly 75% of the federal deficit’s increase will be due to interest costs by 2034.

-

 Mining2 weeks ago
Charted: The Value Gap Between the Gold Price and Gold Miners
-

 Real Estate1 week ago
Ranked: The Most Valuable Housing Markets in America
-

 Markets1 week ago
Charted: Big Four Market Share by S&P 500 Audits
-

 AI1 week ago
The Stock Performance of U.S. Chipmakers So Far in 2024
-

 Automotive1 week ago
Almost Every EV Stock is Down After Q1 2024
-

 Money2 weeks ago
Where Does One U.S. Tax Dollar Go?
-

 Green2 weeks ago
Ranked: Top Countries by Total Forest Loss Since 2001
-

 Real Estate2 weeks ago
Visualizing America’s Shortage of Affordable Homes