Markets
China’s Ultra Rich Lost $100 Billion in Just One Month
What Goes Up, Must Come Down
There’s no doubt that China’s market has been a roller coaster as of late. A year ago, the Shanghai Stock Exchange Composite Index was at close to 2,000 points. However, by June 12, 2015, it skyrocketed to a peak of 5166.35, creating trillions of dollars of paper wealth.
From there, participants in the market have had their will tested, as the market suddenly corrected by dropping 30% in the course of one month.
The Bloomberg Billionaires Index tracks the world’s 400 richest people in the world, including 26 from mainland China. Taking a look at the value of their portfolios can provide some insight as to the ride they are on. Here’s the change in wealth of billionaires in China versus those in Germany for this year:
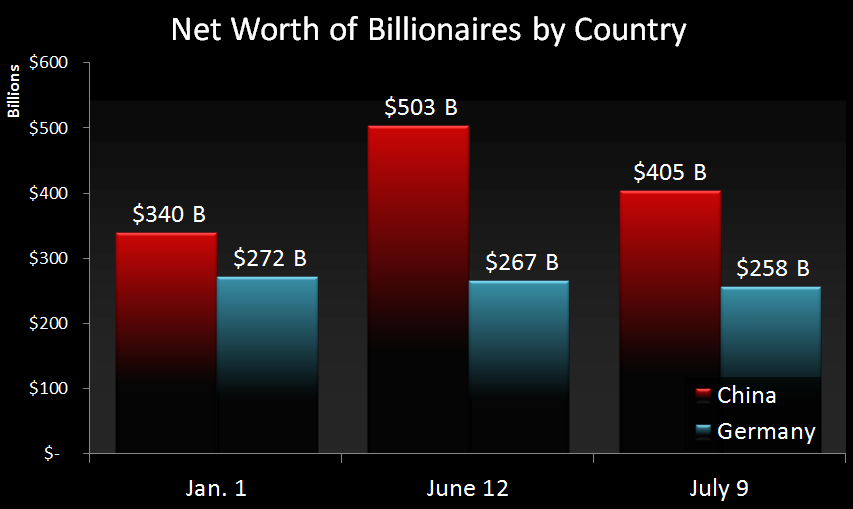
China’s ultra wealthy were up 35% from the start of the year in late May and early June. Then the market crash hit, reeling in their gains to just 10%.
Since then, the stock market has had a bit of a bounce, bringing gains year-to-date to 16% as of last week:
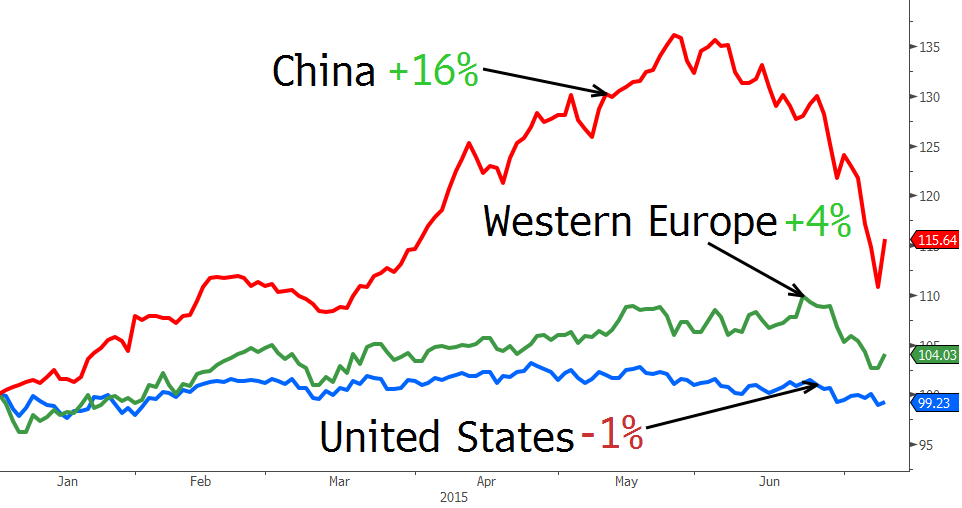
The portfolios of billionaires in the United States and Western Europe are boring in comparison. The wealthiest people in the United States have lost 1% so far in 2015, and those in Western Europe fared better with a 4% increase.
Here’s the whipsaw stories of two Chinese billionaires:
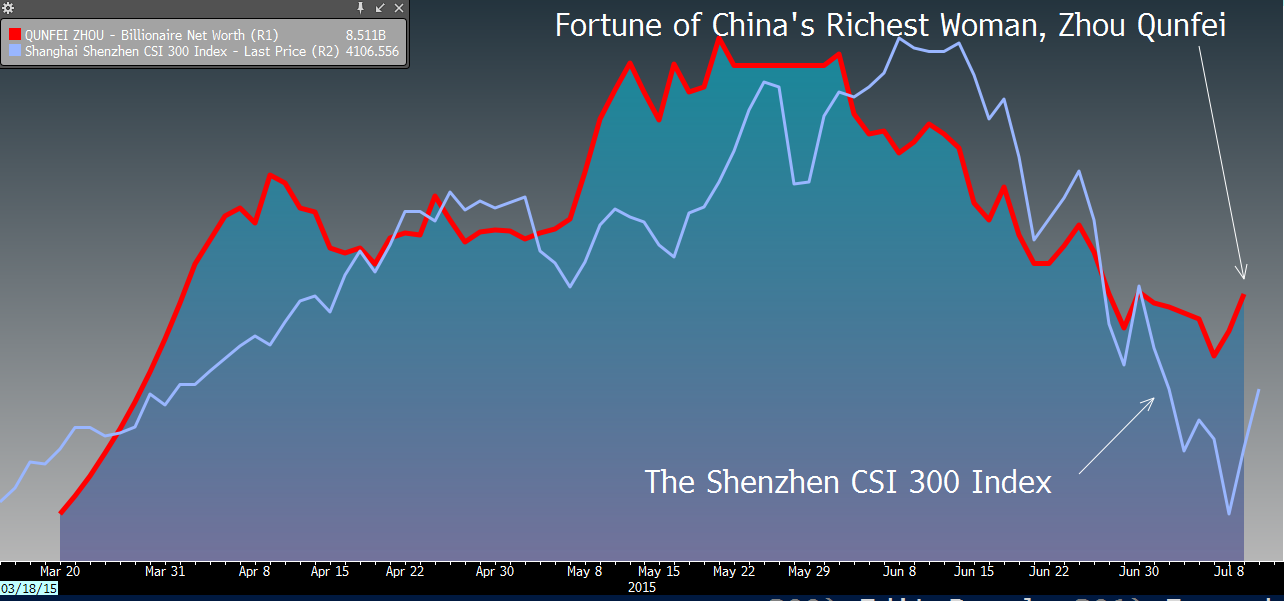
Zhou Qunfei
Zhou Qunfei is China’s richest woman and serves as the chairman of consumer electronics supplier Lens Technology Co Ltd.
Zhou’s fortune soared when Lens Technology IPO’d earlier in the year, as the stock jumped 500% in early trading. Her fortune went up to $10 billion in a matter of months. Then, with the June crash, 40% of her fortune was erased as it decreased by $5 billion.
Pan Sutong
Pan Sutong is the Chinese-born chairman of the Goldin Group, a conglomerate based in Hong Kong. In January, Pan Sutong had $3.7 billion in wealth. Stock in Goldin’s subsidiaries soared, and Mr. Sutong had increased his fortune to peak at an impressive $25 billion.
Since then, the stocks have gotten crushed, bringing him back to where he started: $4 billion.
The Implications of the See-Saw
Most investors in the Chinese markets are “mom and pop” investors – Credit Suisse thinks that 80% of urban Chinese have money in stocks, and many of them don’t even have a high school education. Because of this, there is likely to still be strong volatility as this new group of investors collectively learns how to trade in the market.
China’s ultra rich, meanwhile, are trying to lock in their gains by diversifying elsewhere. This is because the wealthiest people in the country have an unusual amount of wealth tied to public markets compared to the rest of the world: 66% of the wealth of billionaires in China and Hong Kong is “paper wealth” in the public markets.
In the United States and Western Europe, it is less than 50%.
To even out their portfolios, the ultra wealthy have sought out real estate both in China and in foreign markets. This is something we covered out in a recent Chart of the Week as Chinese investors left the volatile stock market in search for a better store of wealth.
See below:
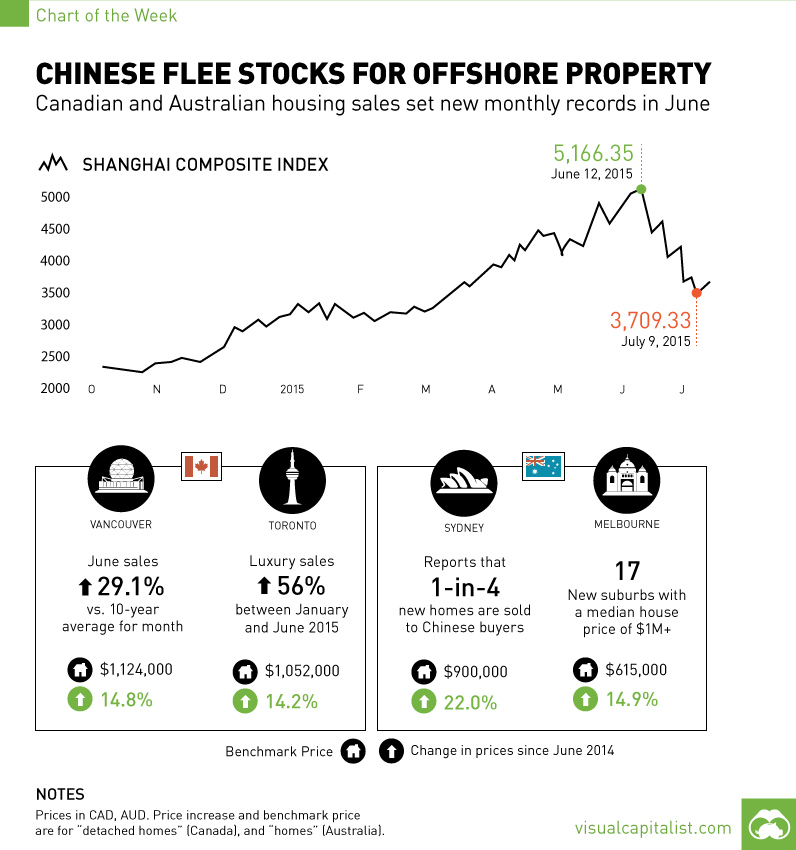
Original graphics from: Bloomberg


Markets
U.S. Debt Interest Payments Reach $1 Trillion
U.S. debt interest payments have surged past the $1 trillion dollar mark, amid high interest rates and an ever-expanding debt burden.


U.S. Debt Interest Payments Reach $1 Trillion
This was originally posted on our Voronoi app. Download the app for free on iOS or Android and discover incredible data-driven charts from a variety of trusted sources.
The cost of paying for America’s national debt crossed the $1 trillion dollar mark in 2023, driven by high interest rates and a record $34 trillion mountain of debt.
Over the last decade, U.S. debt interest payments have more than doubled amid vast government spending during the pandemic crisis. As debt payments continue to soar, the Congressional Budget Office (CBO) reported that debt servicing costs surpassed defense spending for the first time ever this year.
This graphic shows the sharp rise in U.S. debt payments, based on data from the Federal Reserve.
A $1 Trillion Interest Bill, and Growing
Below, we show how U.S. debt interest payments have risen at a faster pace than at another time in modern history:
| Date | Interest Payments | U.S. National Debt |
|---|---|---|
| 2023 | $1.0T | $34.0T |
| 2022 | $830B | $31.4T |
| 2021 | $612B | $29.6T |
| 2020 | $518B | $27.7T |
| 2019 | $564B | $23.2T |
| 2018 | $571B | $22.0T |
| 2017 | $493B | $20.5T |
| 2016 | $460B | $20.0T |
| 2015 | $435B | $18.9T |
| 2014 | $442B | $18.1T |
| 2013 | $425B | $17.2T |
| 2012 | $417B | $16.4T |
| 2011 | $433B | $15.2T |
| 2010 | $400B | $14.0T |
| 2009 | $354B | $12.3T |
| 2008 | $380B | $10.7T |
| 2007 | $414B | $9.2T |
| 2006 | $387B | $8.7T |
| 2005 | $355B | $8.2T |
| 2004 | $318B | $7.6T |
| 2003 | $294B | $7.0T |
| 2002 | $298B | $6.4T |
| 2001 | $318B | $5.9T |
| 2000 | $353B | $5.7T |
| 1999 | $353B | $5.8T |
| 1998 | $360B | $5.6T |
| 1997 | $368B | $5.5T |
| 1996 | $362B | $5.3T |
| 1995 | $357B | $5.0T |
| 1994 | $334B | $4.8T |
| 1993 | $311B | $4.5T |
| 1992 | $306B | $4.2T |
| 1991 | $308B | $3.8T |
| 1990 | $298B | $3.4T |
| 1989 | $275B | $3.0T |
| 1988 | $254B | $2.7T |
| 1987 | $240B | $2.4T |
| 1986 | $225B | $2.2T |
| 1985 | $219B | $1.9T |
| 1984 | $205B | $1.7T |
| 1983 | $176B | $1.4T |
| 1982 | $157B | $1.2T |
| 1981 | $142B | $1.0T |
| 1980 | $113B | $930.2B |
| 1979 | $96B | $845.1B |
| 1978 | $84B | $789.2B |
| 1977 | $69B | $718.9B |
| 1976 | $61B | $653.5B |
| 1975 | $55B | $576.6B |
| 1974 | $50B | $492.7B |
| 1973 | $45B | $469.1B |
| 1972 | $39B | $448.5B |
| 1971 | $36B | $424.1B |
| 1970 | $35B | $389.2B |
| 1969 | $30B | $368.2B |
| 1968 | $25B | $358.0B |
| 1967 | $23B | $344.7B |
| 1966 | $21B | $329.3B |
Interest payments represent seasonally adjusted annual rate at the end of Q4.
At current rates, the U.S. national debt is growing by a remarkable $1 trillion about every 100 days, equal to roughly $3.6 trillion per year.
As the national debt has ballooned, debt payments even exceeded Medicaid outlays in 2023—one of the government’s largest expenditures. On average, the U.S. spent more than $2 billion per day on interest costs last year. Going further, the U.S. government is projected to spend a historic $12.4 trillion on interest payments over the next decade, averaging about $37,100 per American.
Exacerbating matters is that the U.S. is running a steep deficit, which stood at $1.1 trillion for the first six months of fiscal 2024. This has accelerated due to the 43% increase in debt servicing costs along with a $31 billion dollar increase in defense spending from a year earlier. Additionally, a $30 billion increase in funding for the Federal Deposit Insurance Corporation in light of the regional banking crisis last year was a major contributor to the deficit increase.
Overall, the CBO forecasts that roughly 75% of the federal deficit’s increase will be due to interest costs by 2034.

-

 Technology2 weeks ago
Ranked: The Most Popular Smartphone Brands in the U.S.
-

 Misc1 week ago
Almost Every EV Stock is Down After Q1 2024
-

 Money1 week ago
Where Does One U.S. Tax Dollar Go?
-

 Green2 weeks ago
Ranked: Top Countries by Total Forest Loss Since 2001
-

 Real Estate2 weeks ago
Visualizing America’s Shortage of Affordable Homes
-

 Maps2 weeks ago
Mapped: Average Wages Across Europe
-

 Mining2 weeks ago
Charted: The Value Gap Between the Gold Price and Gold Miners
-

 Demographics2 weeks ago
Visualizing the Size of the Global Senior Population