Misc
Visualized: The Daily Routines of Famous Creatives
Article/Editing:
View a higher resolution version of graphic.
Visualized: The Daily Routines of Famous Creatives
What is the best daily routine to unlock creativity, or is there such a thing?
Many modern suggestions for optimizing creativity—like scheduling time for “deep work,” and building small, sustainable “atomic habits”—can be traced back to famous creatives in many different eras. And though they all found success, they employed different methods as well.
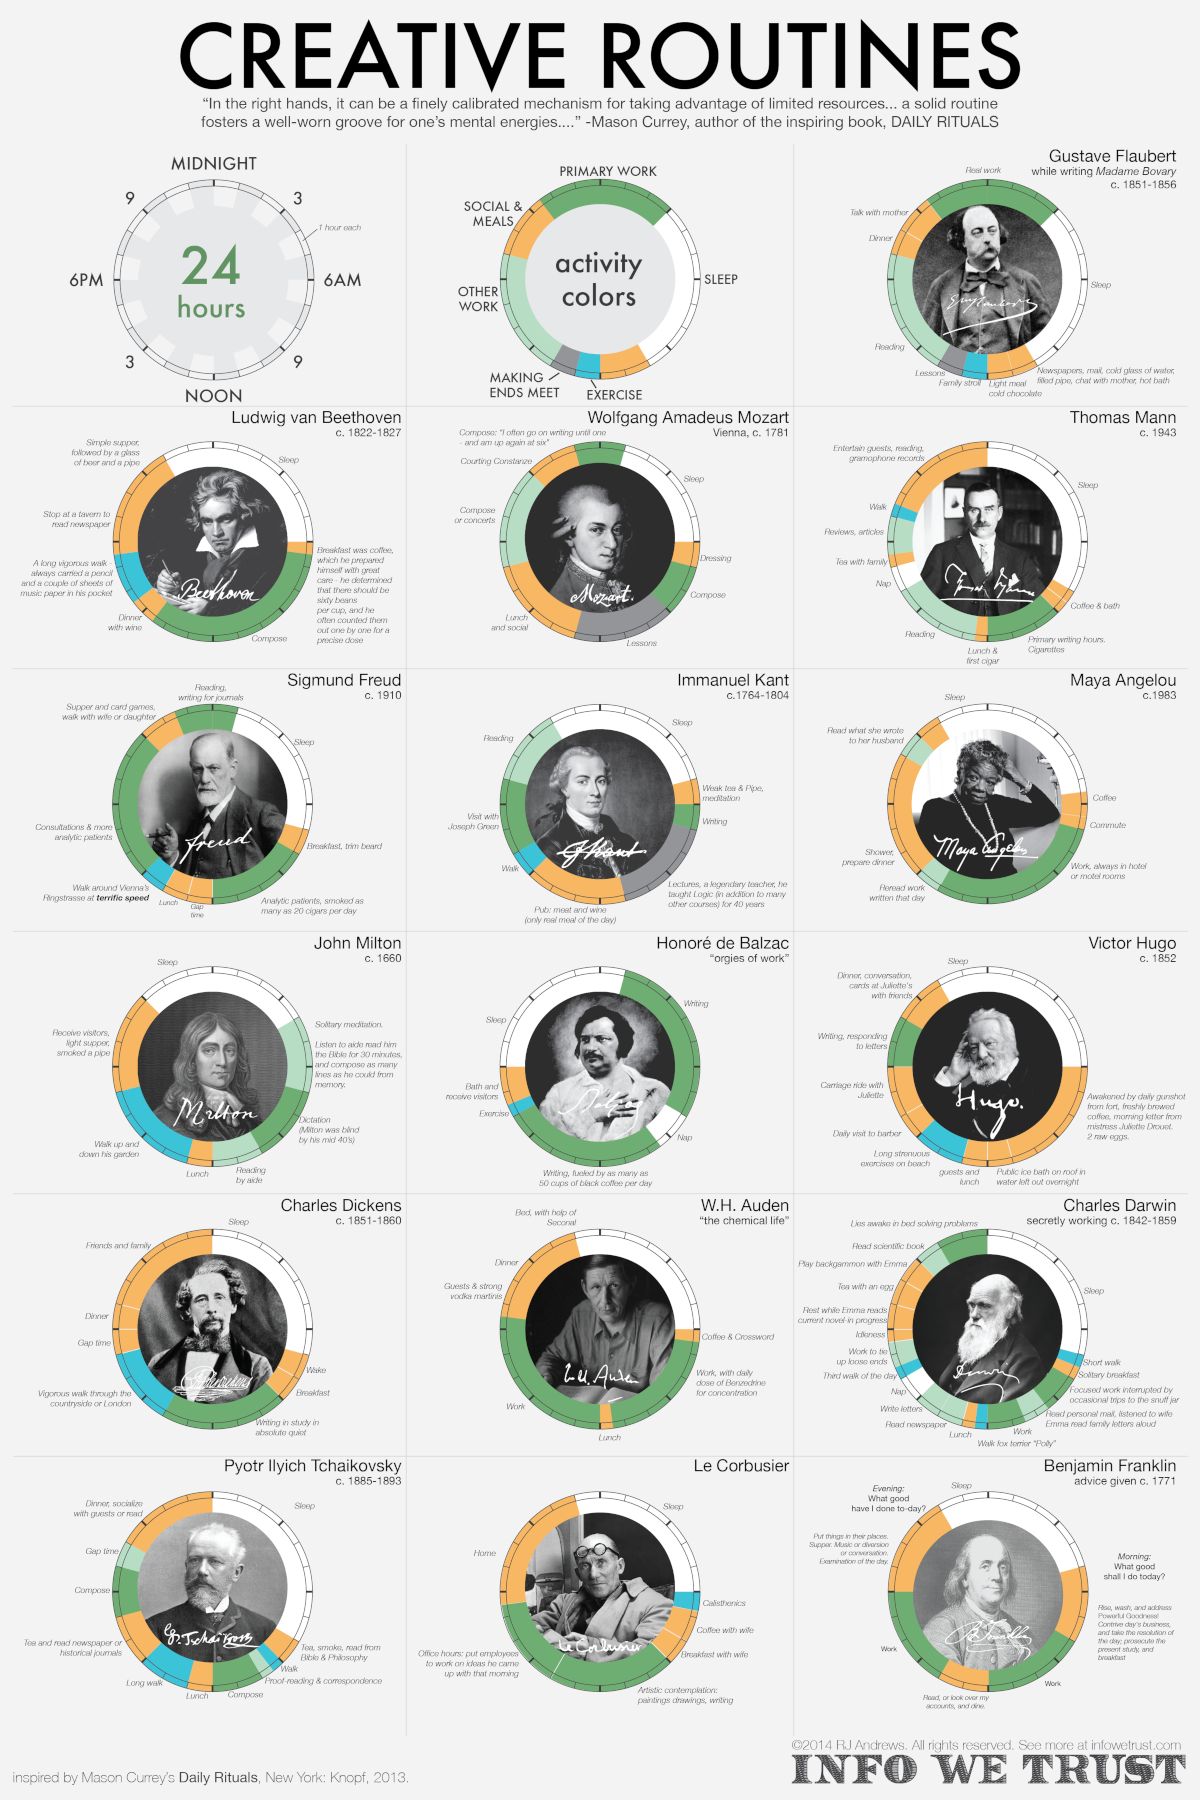
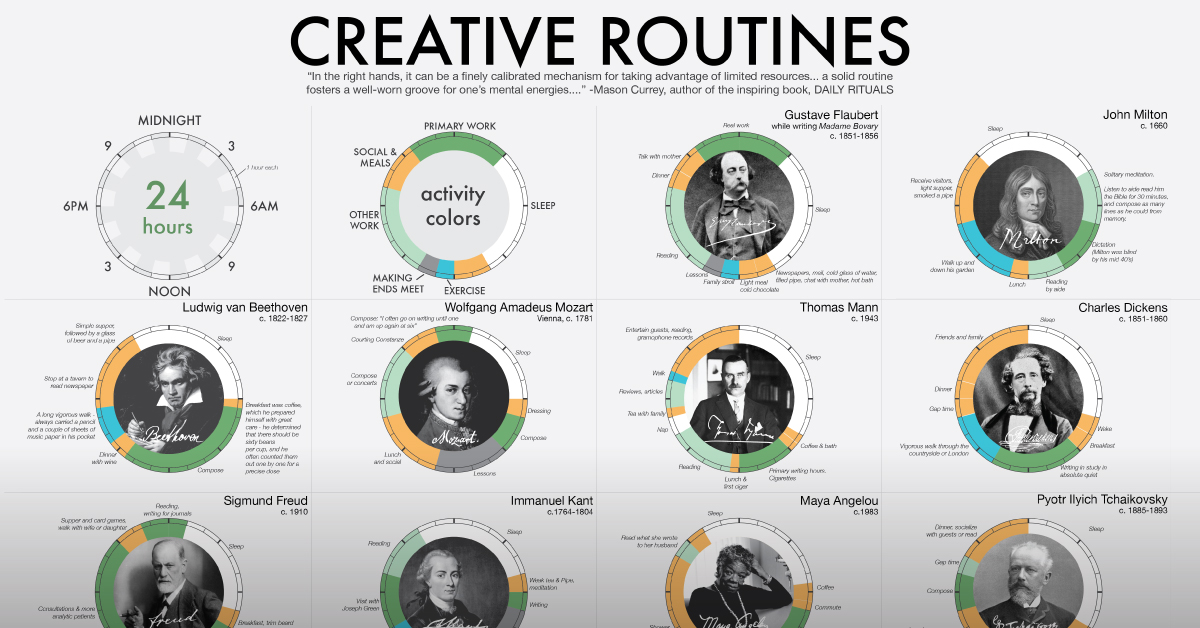
In this unique visualization, RJ Andrews from InfoWeTrust has charted how notable creatives in different fields spent their days. He picked 16 of the 161 “inspired minds” covered by Daily Rituals: How Artists Work, a book by writer and editor Mason Currey published in 2013.
How Much “Creativity Time” in Famous Daily Routines?
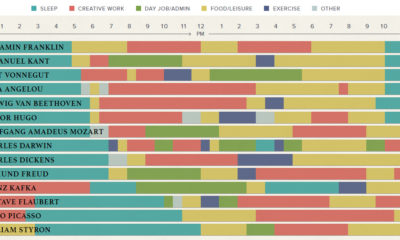
Dividing the day into 24 hours, Andrews denoted certain categories for daily activities like working creatively, sleeping, and other miscellaneous endeavors (meals, leisure, exercise, and social time).
For the creatives with a separate day job—Immanuel Kant and Wolfgang Amadeus Mozart—their ordinary labor is also counted in miscellaneous activities.
Below is a breakdown of the daily routine of all 16 people featured above:
| Name | Occupation | Creative (hrs) | Sleep (hrs) | Miscellaneous (hrs) |
|---|---|---|---|---|
| Maya Angelou | Writer/Poet | 9 | 7.5 | 7.5 |
| W.H. Auden | Poet | 11.5 | 7 | 5.5 |
| Honoré de Balzac | Novelist | 13.5 | 8.5 | 2 |
| L.V. Beethoven | Composer / Pianist | 8 | 8 | 8 |
| Le Corbusier | Architect | 8.5 | 7 | 8.5 |
| Charles Darwin | Naturalist / Biologist/ Geologist | 7 | 8 | 9 |
| Charles Dickens | Writer | 5 | 7 | 12 |
| Gustave Flaubert | Novelist | 10.5 | 7 | 6.5 |
| Sigmund Freud | Psychologist | 12.5 | 6 | 5.5 |
| Benjamin Franklin | Writer / Inventor / Scientist / Statesman | 8 | 7 | 9 |
| Victor Hugo | Writer | 2 | 8 | 14 |
| Immanuel Kant | Philosopher | 7 | 7 | 10 |
| Thomas Mann | Novelist | 8 | 8 | 8 |
| John Milton | Poet | 8 | 7 | 9 |
| W.A. Mozart | Composer / Pianist | 8 | 5 | 11 |
| P.I. Tchaikovsky | Composer | 4.5 | 8 | 11.5 |
The average and median amount of time spent on creative work for these individuals was just over 8 hours a day. At the extremes were two French novelists, Honoré de Balzac with 13.5 hours daily spent on creative work, and Victor Hugo with only 2 hours.
Interestingly, the allocation of creative work time was different in almost every daily routine. Maya Angelou’s routine resembles the modern work day, with the bulk of her writing between 7 a.m. to 2 p.m. Others like Kant and Mozart had creativity blocks when time allowed, such as before and after their teaching jobs.
Then there are outliers like Honoré de Balzac and Sigmund Freud, who worked as much as they could. Balzac wrote from 1:00 a.m. to 4:00 p.m. with just an hour and a half nap break in between, fueled by up to 50 cups of coffee. Freud split up his creative work into three different blocks: analyzing patients in the morning, consulting in the afternoon, and reading and writing journals into the late evening.
But somewhere in their days, most of these brilliant minds made sure to get a good rest, with an average of 7.25 hours of sleep across the board.
Schedule Yourself to Create Success
Creativity may ebb and flow, but these great minds had one clear thing in common: scheduling time for creative work.
The perfect daily routine was usually what fit in with their lifestyle (and their bodies), not based on an arbitrary amount of work. For example, night owls with later chronotypes worked late, while socialites and politicians found time outside of their commitments.
They also found time to move and enjoy life. Half of the people in the dataset specified exercise in their accounts—either leisurely strolls or fast walks. Many also scheduled social time with partners, friends, or children, often paired with a meal.
Perhaps the greatest insight, however, is that the day-to-day routine doesn’t have to look extraordinary to be able to create extraordinary work.

This article was published as a part of Visual Capitalist's Creator Program, which features data-driven visuals from some of our favorite Creators around the world.


Politics
Charted: Trust in Government Institutions by G7 Countries
How much do you trust the government and its various institutions? We look at data for G7 countries for the time period of 2006-2023.


Trust in Government Institutions by G7 Countries
This was originally posted on our Voronoi app. Download the app for free on iOS or Android and discover incredible data-driven charts from a variety of trusted sources.
How much do you trust the government, and its various institutions?
It’s likely that your level of confidence probably depends on a wide range of factors, such as perceived competency, historical context, economic performance, accountability, social cohesion, and transparency.
And for these same reasons, trust levels in government institutions also change all the time, even in the world’s most developed countries: the G7.
Confidence in Government by G7 Countries (2006-2023)
This chart looks at the changes in trust in government institutions between the years 2006 and 2023, based on data from a multi-country Gallup poll.
Specifically, this dataset aggregates confidence in multiple national institutions, including the military, the judicial system, the national government, and the integrity of the electoral system.
| Country | Confidence (2006) | Confidence (2023) | Change (p.p.) |
|---|---|---|---|
| Canada | 57% | 64% | +7 |
| Britain | 63% | 63% | +0 |
| Germany | 55% | 61% | +6 |
| France | 54% | 60% | +6 |
| Japan | 48% | 59% | +11 |
| Italy | 41% | 54% | +13 |
| United States | 63% | 50% | -13 |
What’s interesting here is that in the G7, a group of the world’s most developed economies, there is only one country bucking the general trend: the United States.
Across most G7 countries, confidence in institutions has either improved or stayed the same between 2006 and 2023. The largest percentage point (p.p.) increases occur in Italy and Japan, which saw +13 p.p. and +11 p.p. increases in trust over the time period.
In the U.S., however, confidence in government institutions has fallen by 13 p.p. over the years. What happened?
Key Figures on U.S. Trust in Institutions
In 2006, the U.S. was tied with the UK as having the highest confidence in government institutions, at 63%.
But here’s where the scores stand in 2023, across various institutions:
| 🇺🇸 Institutions | Confidence (2023) |
|---|---|
| Military | 81% |
| Judiciary | 42% |
| National Government | 30% |
| Elections | 44% |
| Overall | 49% |
Based on this data, it’s clear that the U.S. lags behind in three key indicators: confidence in the national government, confidence in the justice system, and confidence in fair elections. It ranked in last place for each indicator in the G7.
One other data point that stands out: despite leading the world in military spending, the U.S. is only the third most confident in its military in the G7. It lags behind France (86%) and the United Kingdom (83%).

-

 Technology6 days ago
All of the Grants Given by the U.S. CHIPS Act
-

 Uranium2 weeks ago
The World’s Biggest Nuclear Energy Producers
-

 Education2 weeks ago
How Hard Is It to Get Into an Ivy League School?
-

 Debt2 weeks ago
How Debt-to-GDP Ratios Have Changed Since 2000
-

 Sports2 weeks ago
The Highest Earning Athletes in Seven Professional Sports
-

 Science2 weeks ago
Visualizing the Average Lifespans of Mammals
-

 Brands1 week ago
How Tech Logos Have Evolved Over Time
-

 Energy1 week ago
Ranked: The Top 10 EV Battery Manufacturers in 2023