Markets
Forecasting the Investing Habits of the Millennial Generation

Forecasting the Investing Habits of the Millennial Generation
According to Accenture, millennials are set to inherit the biggest wealth transfer in history, amounting to an estimated $30 trillion over the course of 30 to 40 years.
While it’s hard to know what this newest generation of investors will do once the funds hit their accounts, there is no shortage of speculation about the habits and attitudes that will characterize their collective approach to wealth management as they age.
Surveying Millennial Investors
Today’s infographic is the result of a partnership with our friends at Morning Brew, a daily business briefing newsletter that skews towards a millennial audience.
It showcases the results of their recent audience survey, which had 9,800 respondents from North America and Europe. All respondents fell between the ages of 18 and 35, representing a group that roughly equates to the business leaders of tomorrow.
The survey’s aim: to get a peek at their current financial habits and attitudes towards investing.
Who is Investing?
Of the respondents, a majority of 68.1% is employed full-time while another 27.6% identified as students. The remaining 4.2% is employed part-time or answered “other”.
Financial goals for these respondents were quite diversified, as seen below.
Primary financial goal:
- 23.8% – Earning a graduate/master’s degree
- 21.5% – Buying a car
- 19.6% – Getting married
- 19.0% – Buying a primary home
- 7.3% – Opening a business
- 6.4% – Having a child
- 2.3% – Buying a vacation home
It’s worth keeping in mind that people in this segment can be at very different stages in their lives. Those at the lower end (18-22 years) are just starting their adult years, while those at the higher end (30-35 years) can be quite a ways into their professional careers.
Portfolio Size and Composition
The vast majority of the cohort surveyed said they invest (89%), with the most common bracket of money invested rising steadily as respondents got older:
- 18 to 22 years old: $1,001-$5,000 (31.7%)
- 23 to 27 years old: $10,001-$50,000 (36.7%)
- 28 to 35 years old: $50,000+ (42.0%)
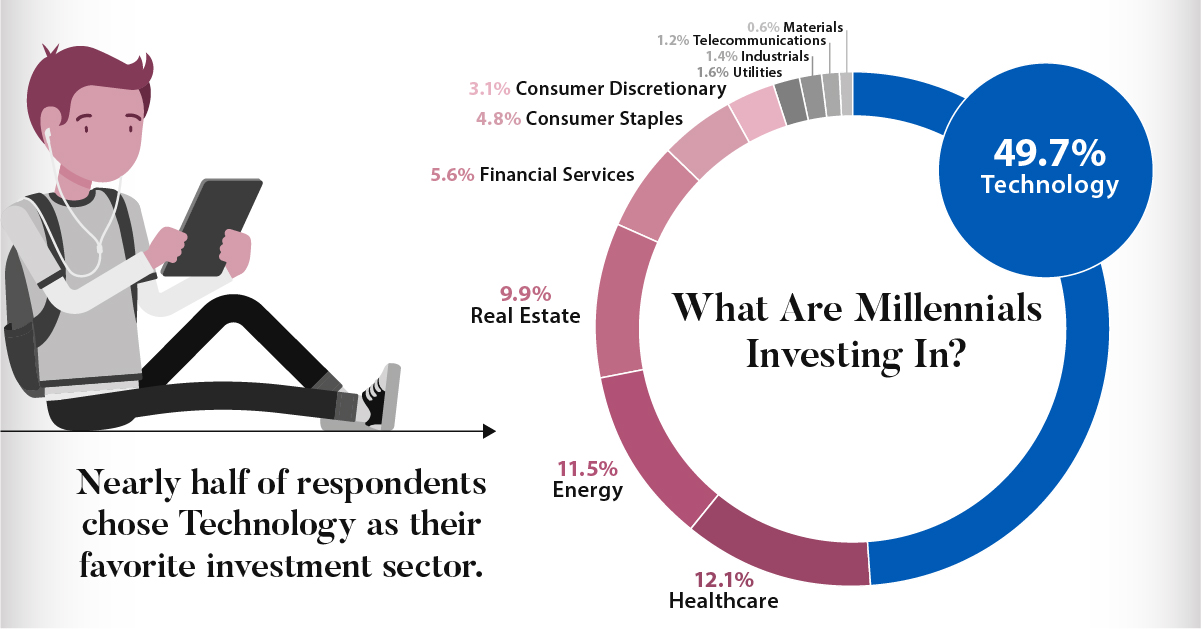
Not surprisingly, technology was the preferred sector to invest in for many in the pool of respondents. Nearly half of people (49.7%) said tech was their favorite sector, with healthcare (12.1%), energy (11.5%), and real estate (9.9%) appearing on the radar as well.
Many sectors were underrepresented here, with financial services (5.6%), consumer staples (4.8%), and consumer discretionary (3.1%) having a relatively low amount of interest. Even worse off were the utilities, industrials, telecommunications, and materials sectors, which held virtually no interest (<2%) among millennial investors.
Millennial Investing Habits
Millennials rate their level of expertise in investing as pretty limited, with only 18.3% of respondents expressing that they had high confidence in their own investment abilities. This is a finding that is consistent with the growing financial literacy problem in America.
The respondents preferred the human touch of financial advisors (70.2%) to robo advisors (29.9%), and were lukewarm towards social impact investing with only 21.1% seeing it as being very important.
As a final exclamation point on the survey results, millennial investors were very clear on what was important to them, and it’s low fees.
When asked how they decide on a professional service, 42.4% saw low fees as a top three deciding factor. At the same time, simplicity (11.6%) and breadth of asset classes (13.1%) were well behind in importance.


Markets
The European Stock Market: Attractive Valuations Offer Opportunities
On average, the European stock market has valuations that are nearly 50% lower than U.S. valuations. But how can you access the market?


European Stock Market: Attractive Valuations Offer Opportunities
Europe is known for some established brands, from L’Oréal to Louis Vuitton. However, the European stock market offers additional opportunities that may be lesser known.
The above infographic, sponsored by STOXX, outlines why investors may want to consider European stocks.
Attractive Valuations
Compared to most North American and Asian markets, European stocks offer lower or comparable valuations.
| Index | Price-to-Earnings Ratio | Price-to-Book Ratio |
|---|---|---|
| EURO STOXX 50 | 14.9 | 2.2 |
| STOXX Europe 600 | 14.4 | 2 |
| U.S. | 25.9 | 4.7 |
| Canada | 16.1 | 1.8 |
| Japan | 15.4 | 1.6 |
| Asia Pacific ex. China | 17.1 | 1.8 |
Data as of February 29, 2024. See graphic for full index names. Ratios based on trailing 12 month financials. The price to earnings ratio excludes companies with negative earnings.
On average, European valuations are nearly 50% lower than U.S. valuations, potentially offering an affordable entry point for investors.
Research also shows that lower price ratios have historically led to higher long-term returns.
Market Movements Not Closely Connected
Over the last decade, the European stock market had low-to-moderate correlation with North American and Asian equities.
The below chart shows correlations from February 2014 to February 2024. A value closer to zero indicates low correlation, while a value of one would indicate that two regions are moving in perfect unison.
| EURO STOXX 50 | STOXX EUROPE 600 | U.S. | Canada | Japan | Asia Pacific ex. China |
|
|---|---|---|---|---|---|---|
| EURO STOXX 50 | 1.00 | 0.97 | 0.55 | 0.67 | 0.24 | 0.43 |
| STOXX EUROPE 600 | 1.00 | 0.56 | 0.71 | 0.28 | 0.48 | |
| U.S. | 1.00 | 0.73 | 0.12 | 0.25 | ||
| Canada | 1.00 | 0.22 | 0.40 | |||
| Japan | 1.00 | 0.88 | ||||
| Asia Pacific ex. China | 1.00 |
Data is based on daily USD returns.
European equities had relatively independent market movements from North American and Asian markets. One contributing factor could be the differing sector weights in each market. For instance, technology makes up a quarter of the U.S. market, but health care and industrials dominate the broader European market.
Ultimately, European equities can enhance portfolio diversification and have the potential to mitigate risk for investors.
Tracking the Market
For investors interested in European equities, STOXX offers a variety of flagship indices:
| Index | Description | Market Cap |
|---|---|---|
| STOXX Europe 600 | Pan-regional, broad market | €10.5T |
| STOXX Developed Europe | Pan-regional, broad-market | €9.9T |
| STOXX Europe 600 ESG-X | Pan-regional, broad market, sustainability focus | €9.7T |
| STOXX Europe 50 | Pan-regional, blue-chip | €5.1T |
| EURO STOXX 50 | Eurozone, blue-chip | €3.5T |
Data is as of February 29, 2024. Market cap is free float, which represents the shares that are readily available for public trading on stock exchanges.
The EURO STOXX 50 tracks the Eurozone’s biggest and most traded companies. It also underlies one of the world’s largest ranges of ETFs and mutual funds. As of November 2023, there were €27.3 billion in ETFs and €23.5B in mutual fund assets under management tracking the index.
“For the past 25 years, the EURO STOXX 50 has served as an accurate, reliable and tradable representation of the Eurozone equity market.”
— Axel Lomholt, General Manager at STOXX
Partnering with STOXX to Track the European Stock Market
Are you interested in European equities? STOXX can be a valuable partner:
- Comprehensive, liquid and investable ecosystem
- European heritage, global reach
- Highly sophisticated customization capabilities
- Open architecture approach to using data
- Close partnerships with clients
- Part of ISS STOXX and Deutsche Börse Group
With a full suite of indices, STOXX can help you benchmark against the European stock market.
Learn how STOXX’s European indices offer liquid and effective market access.

-

 Economy2 days ago
Economic Growth Forecasts for G7 and BRICS Countries in 2024
The IMF has released its economic growth forecasts for 2024. How do the G7 and BRICS countries compare?
-

 Markets2 weeks ago
U.S. Debt Interest Payments Reach $1 Trillion
U.S. debt interest payments have surged past the $1 trillion dollar mark, amid high interest rates and an ever-expanding debt burden.
-

 United States2 weeks ago
Ranked: The Largest U.S. Corporations by Number of Employees
We visualized the top U.S. companies by employees, revealing the massive scale of retailers like Walmart, Target, and Home Depot.
-

 Markets2 weeks ago
The Top 10 States by Real GDP Growth in 2023
This graphic shows the states with the highest real GDP growth rate in 2023, largely propelled by the oil and gas boom.
-

 Markets2 weeks ago
Ranked: The World’s Top Flight Routes, by Revenue
In this graphic, we show the highest earning flight routes globally as air travel continued to rebound in 2023.
-

 Markets3 weeks ago
Ranked: The Most Valuable Housing Markets in America
The U.S. residential real estate market is worth a staggering $47.5 trillion. Here are the most valuable housing markets in the country.

-

 Debt1 week ago
How Debt-to-GDP Ratios Have Changed Since 2000
-
Markets2 weeks ago
Ranked: The World’s Top Flight Routes, by Revenue
-

 Countries2 weeks ago
Population Projections: The World’s 6 Largest Countries in 2075
-
Markets2 weeks ago
The Top 10 States by Real GDP Growth in 2023
-

 Demographics2 weeks ago
The Smallest Gender Wage Gaps in OECD Countries
-

 United States2 weeks ago
Where U.S. Inflation Hit the Hardest in March 2024
-

 Green2 weeks ago
Top Countries By Forest Growth Since 2001
-
United States2 weeks ago
Ranked: The Largest U.S. Corporations by Number of Employees