

How much do you trust the government and its various institutions? We look at data for G7 countries for the...
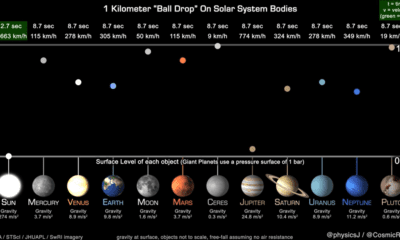

This unique animation, created by a planetary astronomer, compares and highlights the gravitational pull of the planets.
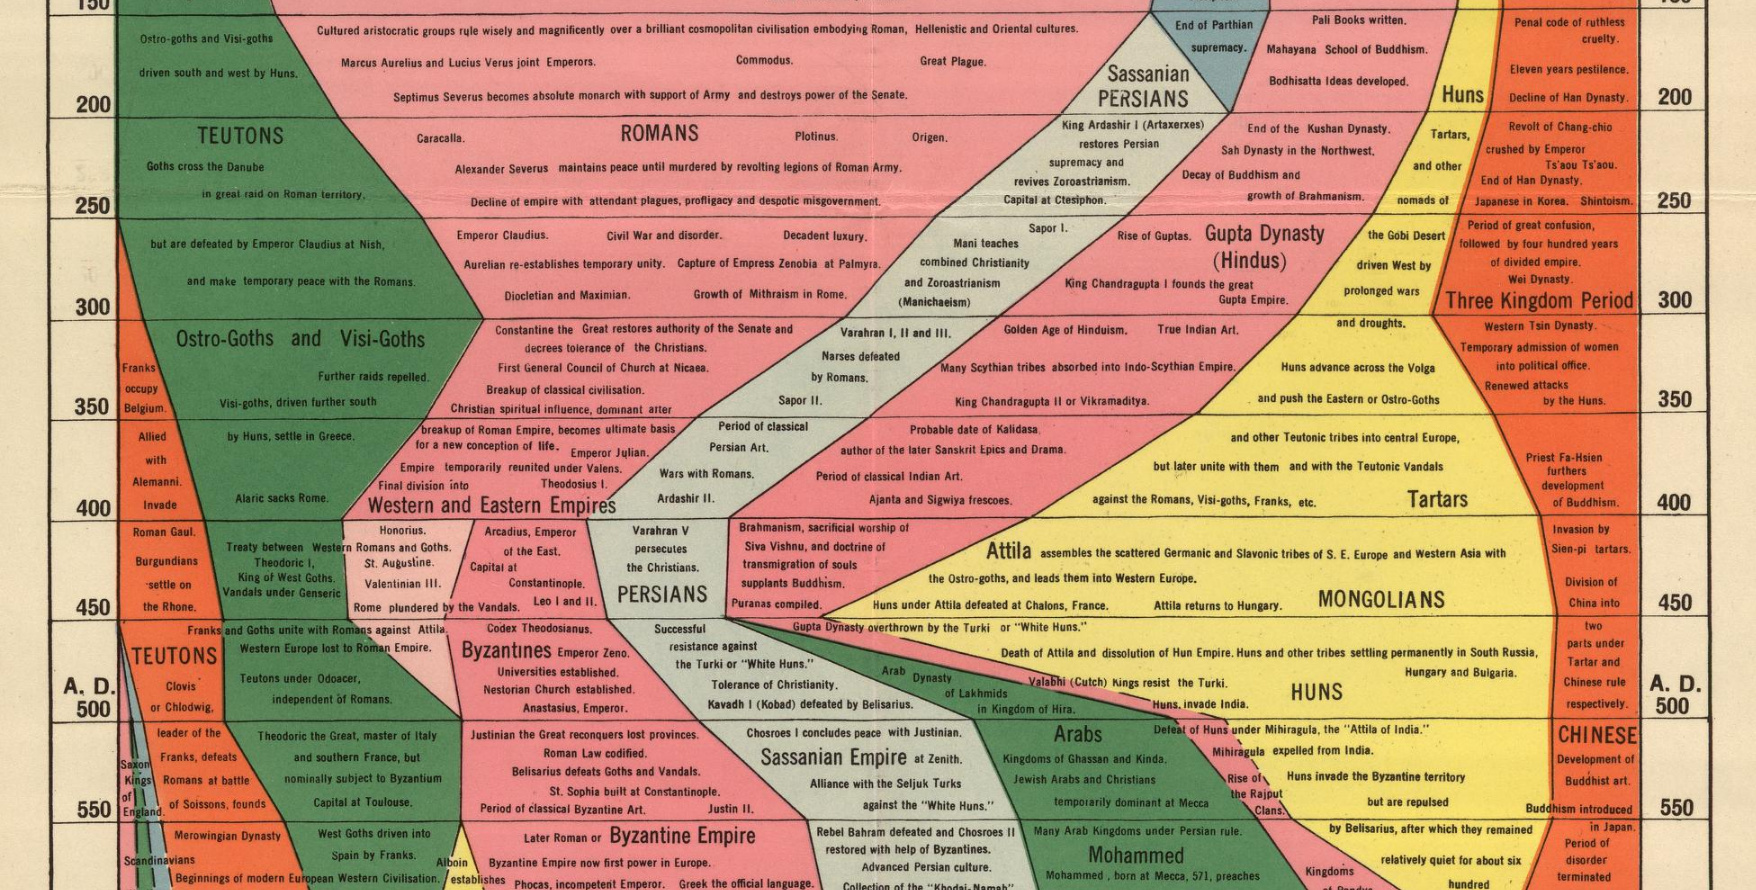
We examine an ambitious timeline that details the power of various civilizations going all the way back to 2,000 B.C.
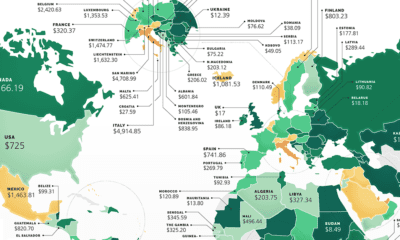

These maps show the most (and least) costly countries for starting a business by relative costs.
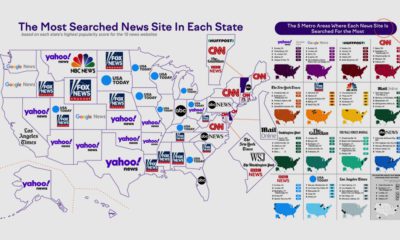

American states have some key differences for their favorite news sites. Here's how they rank by monthly visitors and state popularity.
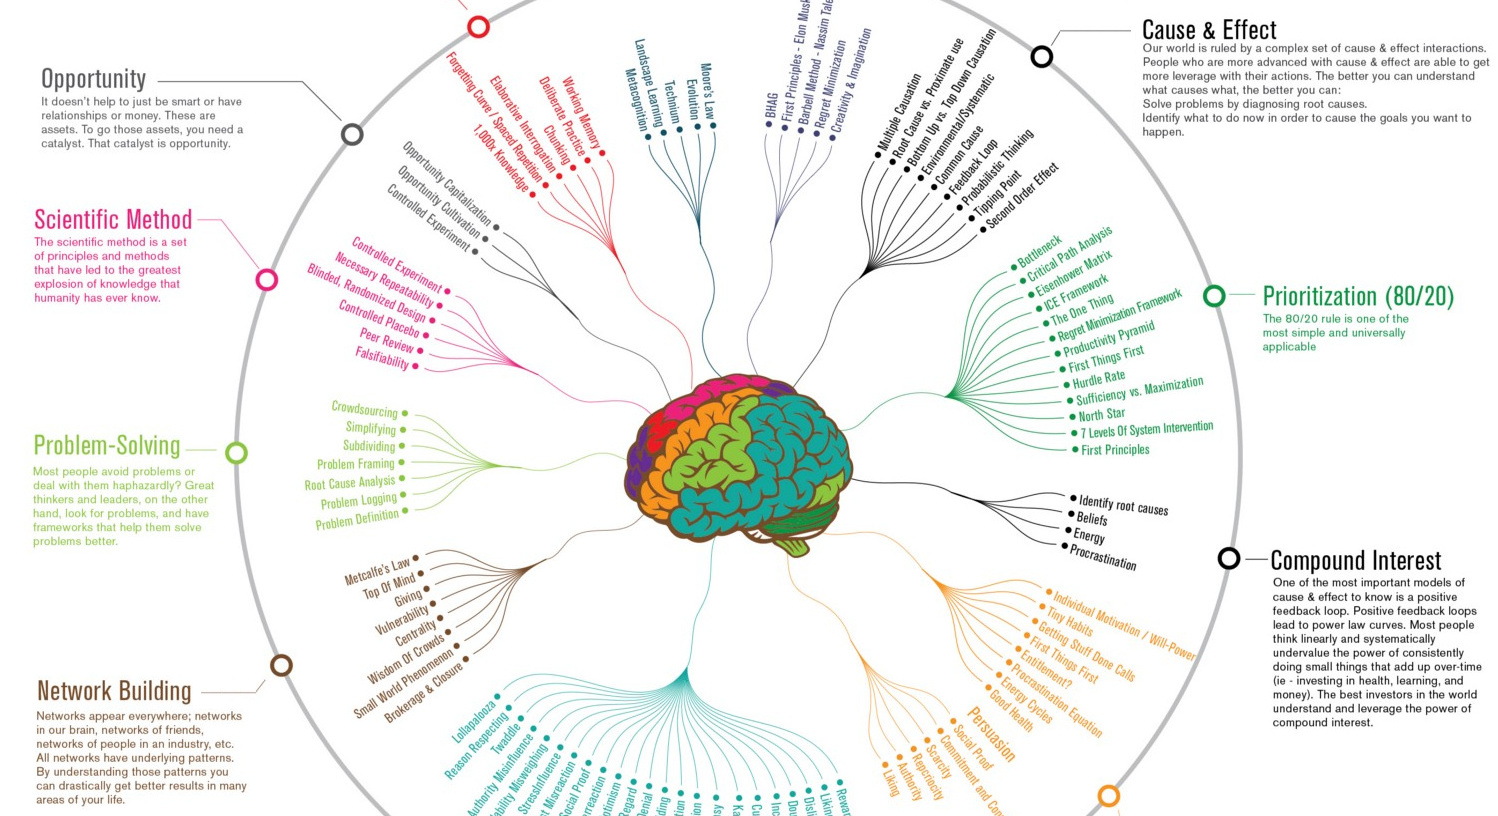
Highlighting and breaking down the 12 most useful and universal mental models that will make you smarter and more productive.
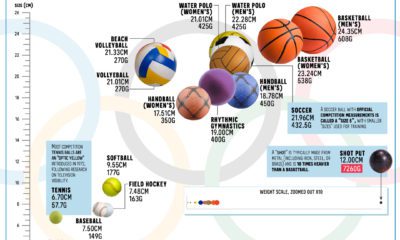

Here are the different sizes and weights of each Olympic sports ball used in the Tokyo Olympics.
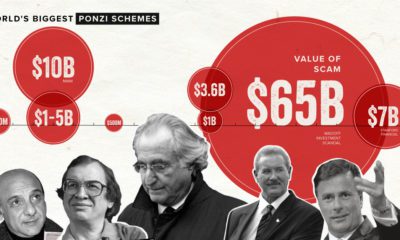

Learn the stories behind some of the world's biggest Ponzi schemes in this illustrative infographic timeline.
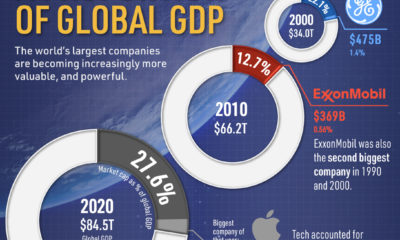

The world's top 50 companies are becoming more valuable, especially compared to global GDP.
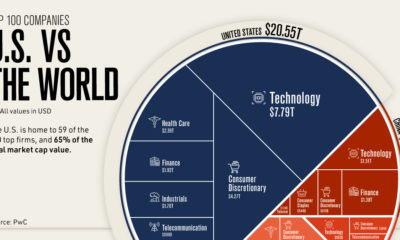

Where are the top 100 companies of the world located? We highlight the U.S. share of the top companies by market capitalization .
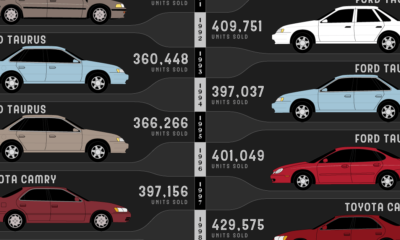

From the Cutlass to the Camry, this graphic shows 40+ years of the most-purchased cars in the U.S.


