Misc
Visualizing the Gravitational Pull of the Planets
Visualizing the Gravitational Pull of the Planets
Gravity is one of the basic forces in the universe. Every object out there exerts a gravitational influence on every other object, but to what degree?
The gravity of the sun keeps all the planets in orbit in our solar system. However, each planet, moon and asteroid have their own gravitational pull defined by their density, size, mass, and proximity to other celestial bodies.
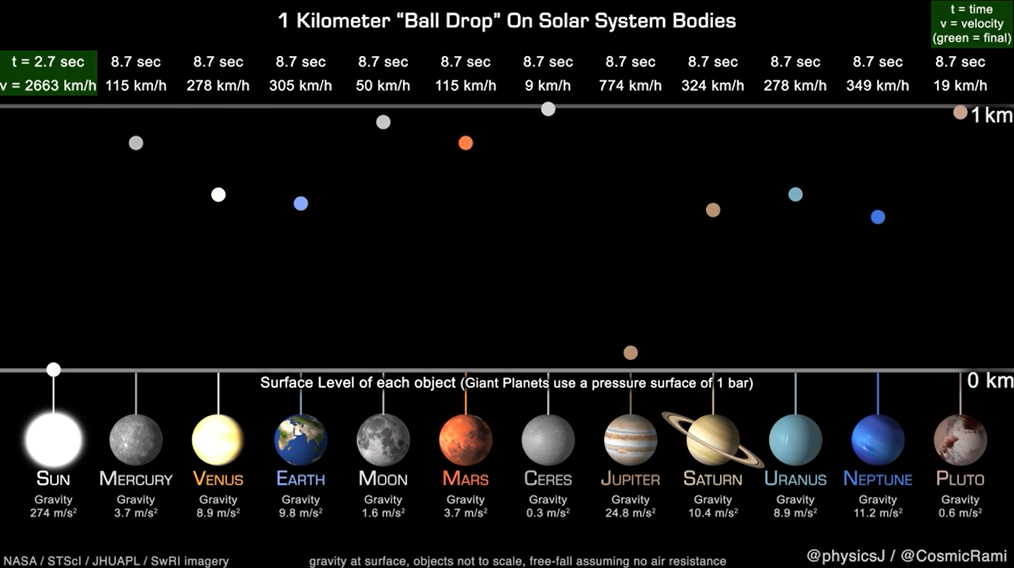
Dr. James O’Donoghue, a Planetary Astronomer at JAXA (Japan Aerospace Exploration Agency) created an animation that simplifies this concept by animating the time it takes a ball to drop from 1,000 meters to the surface of each planet and the Earth’s moon, assuming no air resistance, to better visualize the gravitational pull of the planets.
Sink like a Stone or Float like a Feather
Now, if you were hypothetically landing your spacecraft on a strange planet, you would want to know your rate of descent. Would you float like a feather or sink like a stone?
It is a planet’s size, mass, and density that determines how strong its gravitational pull is, or, how quick or slow you will approach the surface.
| Mass (1024kg) | Diameter (km) | Density (kg/m3) | Gravity (m/s2) | Escape Velocity (km/s) | |
|---|---|---|---|---|---|
| Mercury | 0.33 | 4,879 | 5,427 | 3.7 | 4.3 |
| Venus | 4.87 | 12,104 | 5,243 | 8.9 | 10.4 |
| Earth | 5.97 | 12,756 | 5,514 | 9.8 | 11.2 |
| Moon | 0.073 | 3,475 | 3,340 | 1.6 | 2.4 |
| Mars | 0.642 | 6,792 | 3,933 | 3.7 | 5.0 |
| Jupiter | 1,898 | 142,984 | 1,326 | 23.1 | 59.5 |
| Saturn | 568 | 120,536 | 687 | 9.0 | 35.5 |
| Uranus | 86.8 | 51,118 | 1,271 | 8.7 | 21.3 |
| Neptune | 102 | 49,528 | 1,638 | 11.0 | 23.5 |
| Pluto | 0.0146 | 2,370 | 2,095 | 0.7 | 1.3 |
According to Dr. O’Donoghue, large planets have gravity comparable to smaller ones at the surface—for example, Uranus attracts the ball down slower than on Earth. This is because the relatively low average density of Uranus puts the actual surface of the planet far away from the majority of the planet’s mass in the core.
Similarly, Mars is almost double the mass of Mercury, but you can see the surface gravity is actually the same which demonstrates that Mercury is much denser than Mars.
Exploring the Outer Reaches: Gravity Assistance
Knowing the pull of each of the planets can help propel space flight to the furthest extents of the solar system. The “gravity assist” flyby technique can add or subtract momentum to increase or decrease the energy of a spacecraft’s orbit.
Generally it has been used in solar orbit, to increase a spacecraft’s velocity and propel it outward in the solar system, much farther away from the sun than its launch vehicle would have been capable of doing, as in the journey of NASA’s Voyager 2.
Launched in 1977, Voyager 2 flew by Jupiter for reconnaissance, and for a trajectory boost to Saturn. It then relied on a gravity assist from Saturn and then another from Uranus, propelling it to Neptune and beyond.
Despite the assistance, Voyager 2’s journey still took over 20 years to reach the edge of the solar system. The potential for using the power of gravity is so much more…
Tractor Beams, Shields, and Warp Drives…Oh My!
Imagine disabling an enemy starship with a gravity beam and deflecting an incoming photon torpedo with gravity shields. It would be incredible and a sci-fi dream come true.
However, technology is still 42 years from the fictional date in Star Trek when mankind built the first warp engine, harnessing the power of gravity and unlocking the universe for discovery. There is still time!
Currently, the ALPHA Experiment at CERN is investigating whether it is possible to create some form of anti-gravitational field. This research could create a gravitational conductor shield to counteract the forces of gravity and allow the creation of a warp drive.
By better understanding the forces that keep us grounded on our planets, the sooner we will be able to escape these forces and feel the gravitational pull of the planets for ourselves.
…to boldly go where no one has gone before!


Maps
The Largest Earthquakes in the New York Area (1970-2024)
The earthquake that shook buildings across New York in April 2024 was the third-largest quake in the Northeast U.S. over the past 50 years.


The Largest Earthquakes in the New York Area
This was originally posted on our Voronoi app. Download the app for free on Apple or Android and discover incredible data-driven charts from a variety of trusted sources.
The 4.8 magnitude earthquake that shook buildings across New York on Friday, April 5th, 2024 was the third-largest quake in the U.S. Northeast area over the past 50 years.
In this map, we illustrate earthquakes with a magnitude of 4.0 or greater recorded in the Northeastern U.S. since 1970, according to the United States Geological Survey (USGS).
Shallow Quakes and Older Buildings
The earthquake that struck the U.S. Northeast in April 2024 was felt by millions of people from Washington, D.C., to north of Boston. It even caused a full ground stop at Newark Airport.
The quake, occurring just 5 km beneath the Earth’s surface, was considered shallow, which is what contributed to more intense shaking at the surface.
According to the USGS, rocks in the eastern U.S. are significantly older, denser, and harder than those on the western side, compressed by time. This makes them more efficient conduits for seismic energy. Additionally, buildings in the Northeast tend to be older and may not adhere to the latest earthquake codes.
Despite disrupting work and school life, the earthquake was considered minor, according to the Michigan Technological University magnitude scale:
| Magnitude | Earthquake Effects | Estimated Number Each Year |
|---|---|---|
| 2.5 or less | Usually not felt, but can be recorded by seismograph. | Millions |
| 2.5 to 5.4 | Often felt, but only causes minor damage. | 500,000 |
| 5.5 to 6.0 | Slight damage to buildings and other structures. | 350 |
| 6.1 to 6.9 | May cause a lot of damage in very populated areas. | 100 |
| 7.0 to 7.9 | Major earthquake. Serious damage. | 10-15 |
| 8.0 or greater | Great earthquake. Can totally destroy communities near the epicenter. | One every year or two |
The largest earthquake felt in the area over the past 50 years was a 5.3 magnitude quake that occurred in Au Sable Forks, New York, in 2002. It damaged houses and cracked roads in a remote corner of the Adirondack Mountains, but caused no injuries.
| Date | Magnitude | Location | State |
|---|---|---|---|
| April 20, 2002 | 5.3 | Au Sable Forks | New York |
| October 7, 1983 | 5.1 | Newcomb | New York |
| April 5, 2024 | 4.8 | Whitehouse Station | New Jersey |
| October 16, 2012 | 4.7 | Hollis Center | Maine |
| January 16, 1994 | 4.6 | Sinking Spring | Pennsylvania |
| January 19, 1982 | 4.5 | Sanbornton | New Hampshire |
| September 25, 1998 | 4.5 | Adamsville | Pennsylvania |
| June 9, 1975 | 4.2 | Altona | New York |
| May 29, 1983 | 4.2 | Peru | Maine |
| April 23, 1984 | 4.2 | Conestoga | Pennsylvania |
| January 16, 1994 | 4.2 | Sinking Spring | Pennsylvania |
| November 3, 1975 | 4 | Long Lake | New York |
| June 17, 1991 | 4 | Worcester | New York |
The largest earthquake in U.S. history, however, was the 1964 Good Friday quake in Alaska, measuring 9.2 magnitude and killing 131 people.

-

 Technology2 weeks ago
Ranked: The Most Popular Smartphone Brands in the U.S.
-

 Automotive1 week ago
Almost Every EV Stock is Down After Q1 2024
-

 Money1 week ago
Where Does One U.S. Tax Dollar Go?
-

 Green2 weeks ago
Ranked: Top Countries by Total Forest Loss Since 2001
-

 Real Estate2 weeks ago
Visualizing America’s Shortage of Affordable Homes
-

 Maps2 weeks ago
Mapped: Average Wages Across Europe
-

 Mining2 weeks ago
Charted: The Value Gap Between the Gold Price and Gold Miners
-

 Demographics2 weeks ago
Visualizing the Size of the Global Senior Population