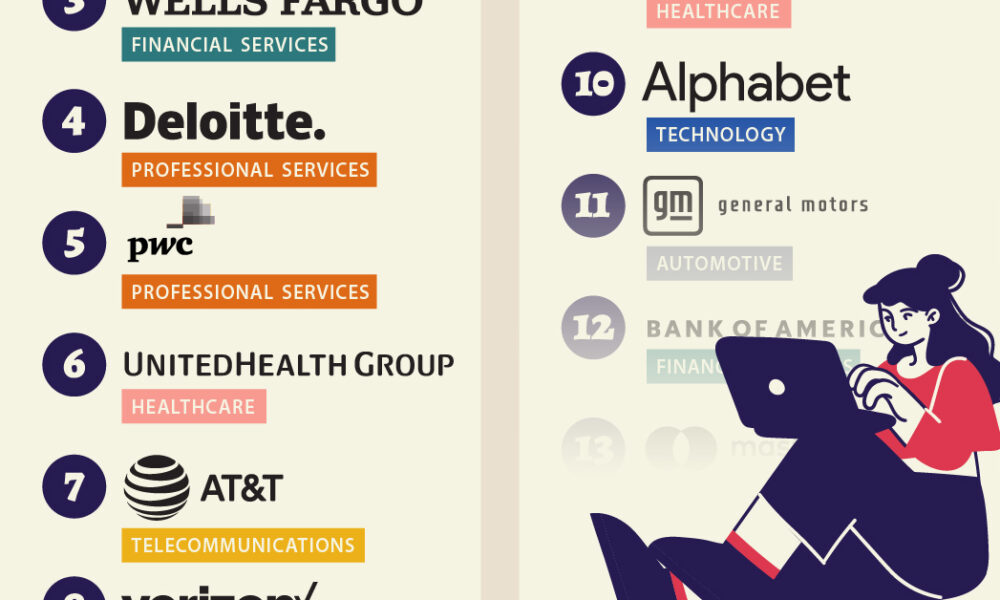
We visualized the results of a LinkedIn study on the best U.S. companies to work for in 2024.
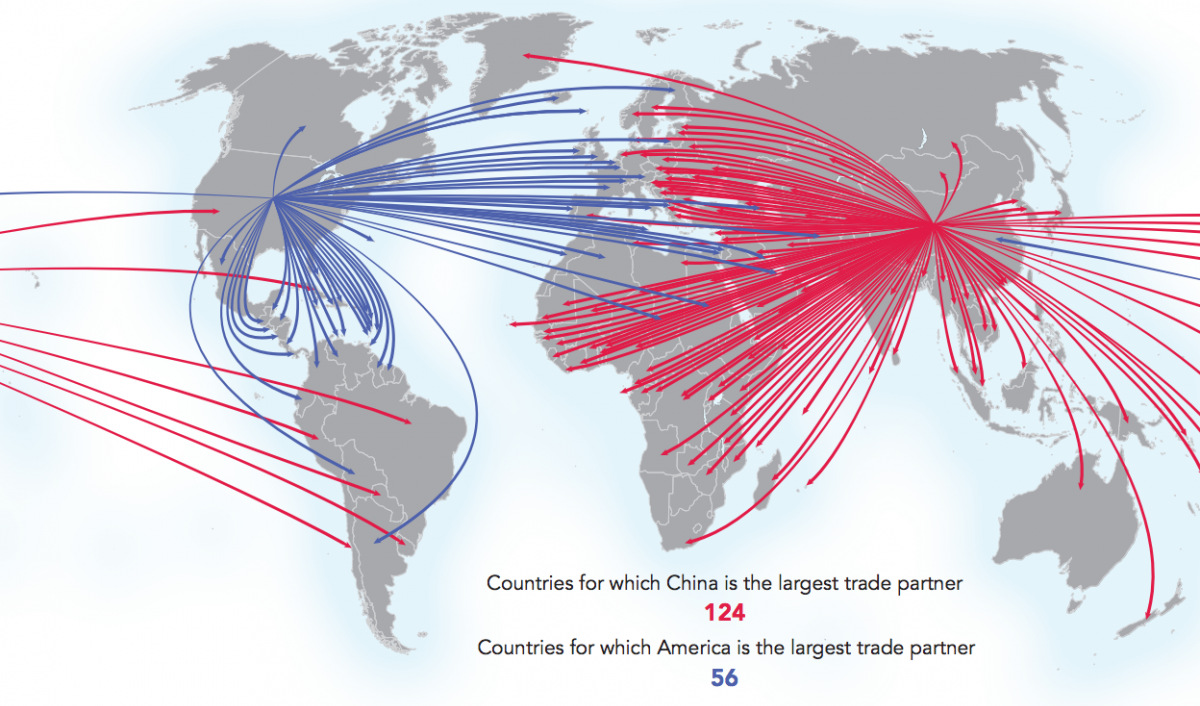
These four maps tell the story of Chinese trade dominance and ambitions. See how Beijing's sphere of influence is rapidly changing.
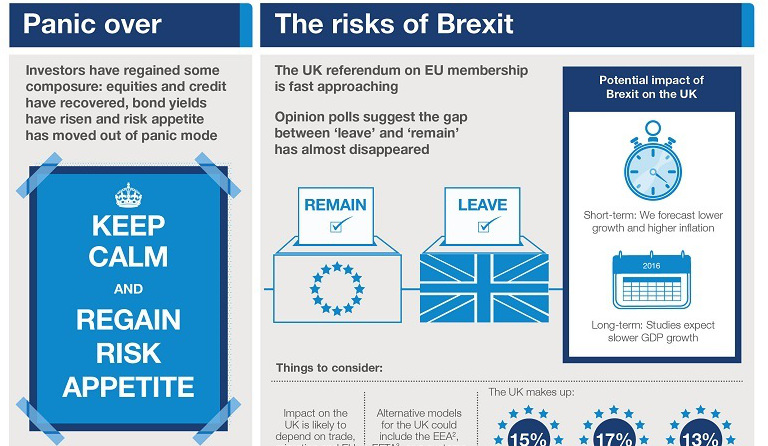
The global economic climate finally has composure, according to asset management firm Schroders. It may be the calm before the storm, though.
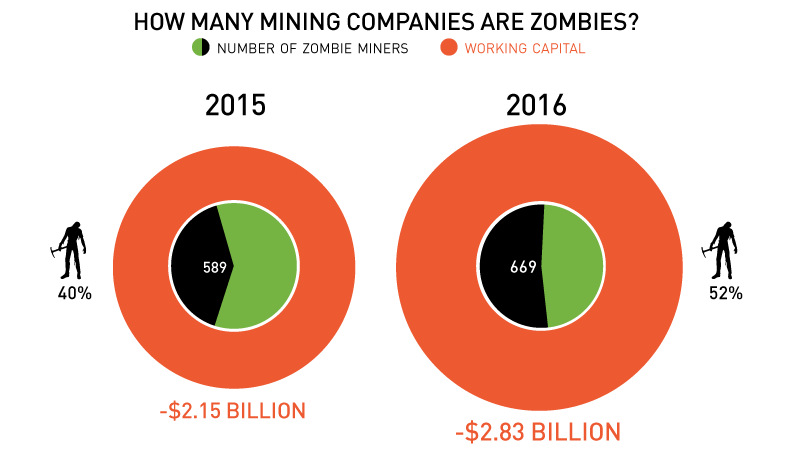
Mind-blowing fact: 52% of Canadian-listed mining companies are now considered "zombies", or companies with negative working capital.
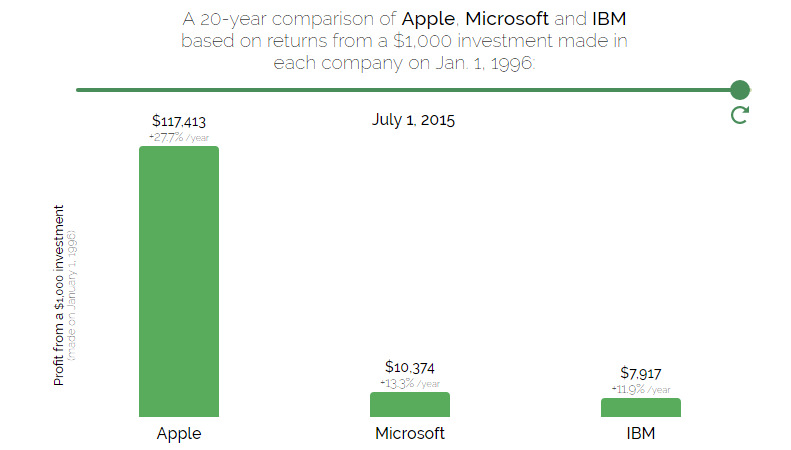
Going back 20 years, which stock would you buy? It turns out to be not even close between Apple and Microsoft.
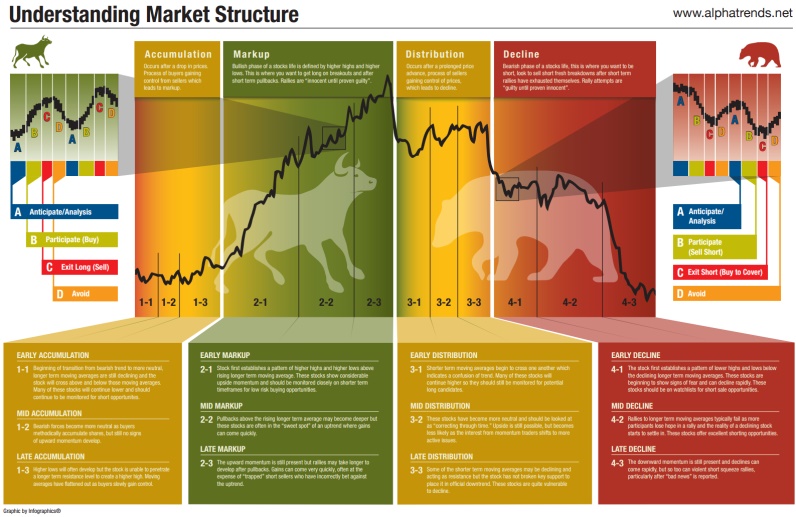

Understanding these different phases of the market cycle will help give you conviction on stock buying opportunities.
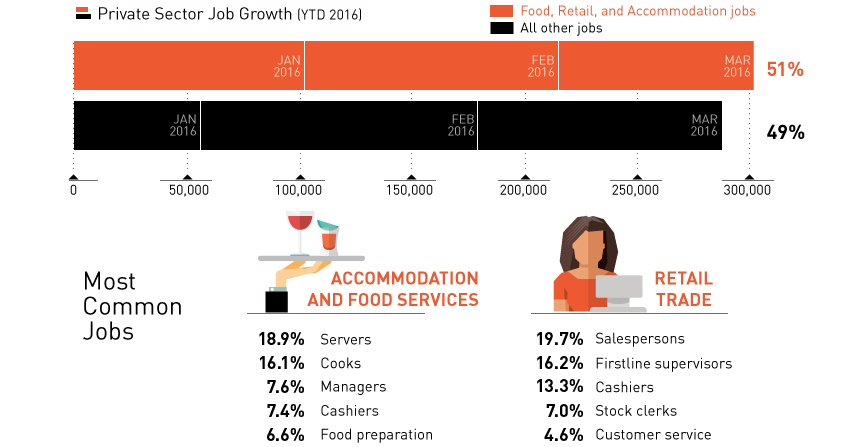
So far in 2016, a total of 589k private sector jobs have been created by the U.S. economy. However, 51% of these jobs are in two...

Today, credit cards are a key source of profits for big banks. But, it wasn't always this way - the history of credit cards shows things...
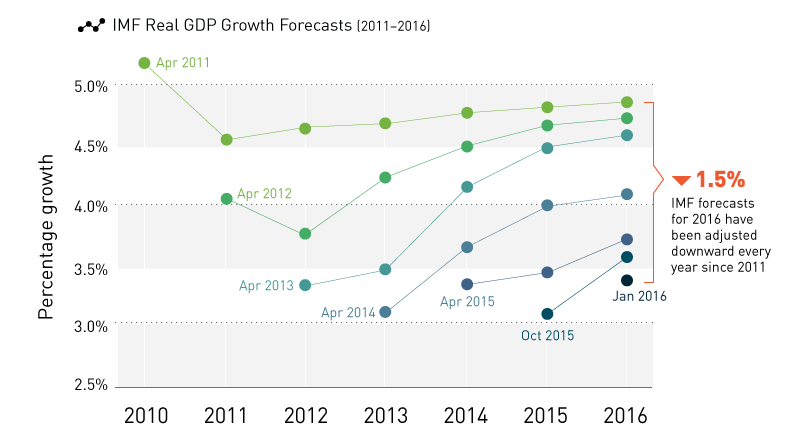
After five years of downward revisions to global real GDP growth, will next week's IMF economic report finally be grounded in reality?
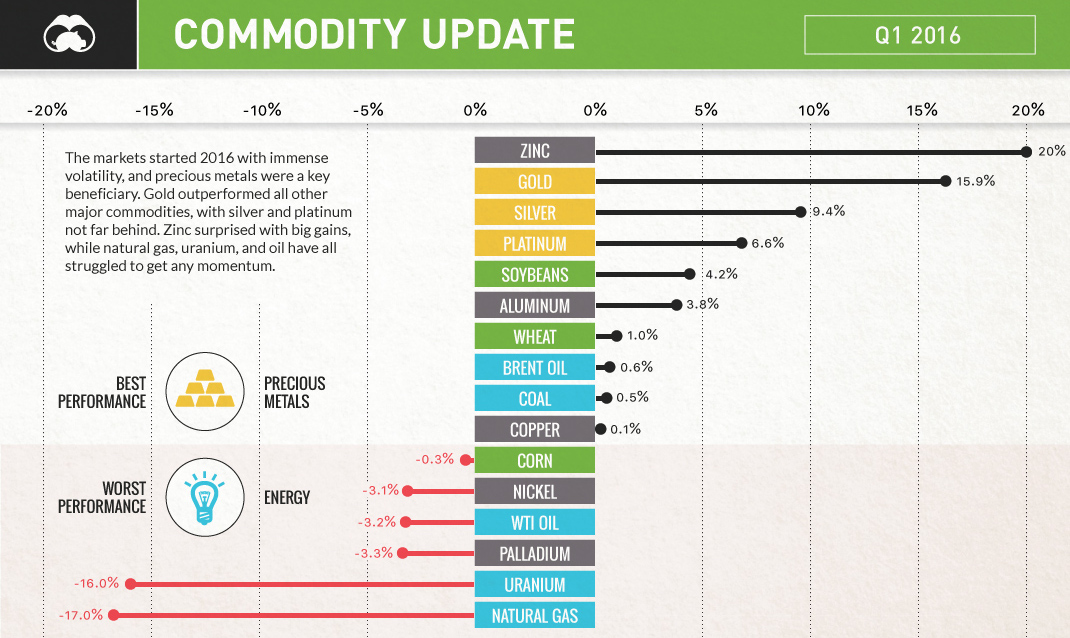
How did commodities do in Q1 of 2016? It's a mixed bag - precious metals rocketed amid market volatility, while natural gas and uranium got pounded.
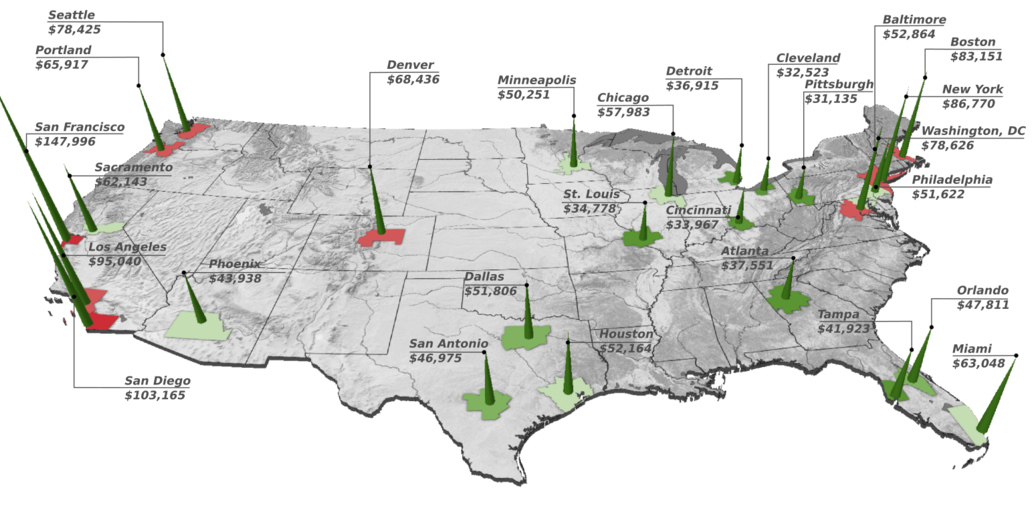
How much do you need to make to buy a home in different cities across the country? Here's the salary needed to buy a home in...