Mining
The March of the Zombie Miners Continues [Chart]
![The March of the Zombie Miners Continues [Chart]](https://www.visualcapitalist.com/wp-content/uploads/2016/04/zombie-miners-working-capital-yoy.png)
The March of the Zombie Miners Continues [Chart]
New report shows that over half (52%) of all Canadian-listed mining companies are zombies
The Chart of the Week is a weekly Visual Capitalist feature on Fridays.
Canada has a reputation worldwide as the epicenter for mining exploration, and over the years the country’s junior-listed companies have created billions of dollars in wealth through new mineral discoveries.
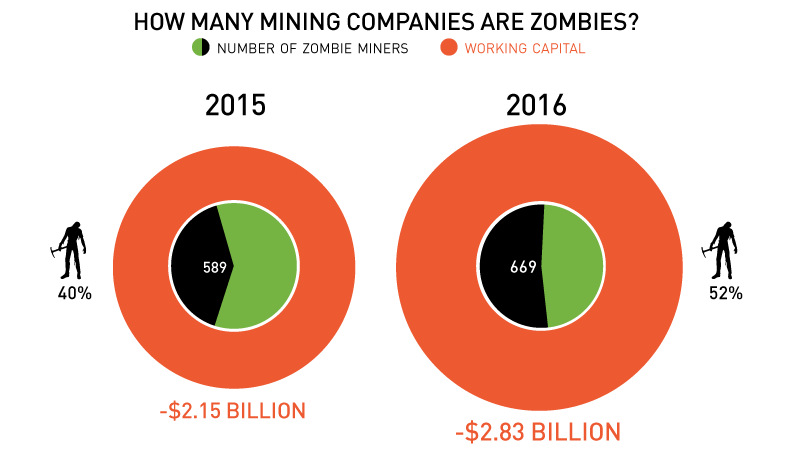
However, these days, Canada is home to a horror story that seems to haunt investors more each year: 52% of all Canadian mining stocks are now “zombies”, and together the walking dead combine for a total of -$2.8 billion in negative working capital.
The “Zombie” Backstory
It was just over a year ago that Tony Simon, President of Seguro Consulting, brought to our attention the initial problem of the zombie miners.
In this case, his “zombie” definition referred to mining exploration companies that had negative working capital and therefore did not meet the Continuous Listing Requirements (CLR) for the TSX and TSX-V stock exchanges.
Our chart from last year called “A Miner Problem” detailed these requirements, while also showing the ugly state of the 589 listed companies’ balance sheets. Many of these companies have negative working capital because they have no real assets that can be monetized, while being saddled with mounting costs or unsustainable debt.
Zombie Survival Tactics
Break out your Zombie Survival Kit, because we now have another year’s worth of information from Mr. Simon, who is a CPA by designation.
Here are the stats that caught our eye, most of which are also included in this week’s chart:
- The number of zombie miners increased from 589 to 669.
- Zombies now make up 52% (up from 40%) of all mining companies in Canada listed on TSX and TSX-V exchanges.
- The average zombie has had negative working capital for 44 months.
- Negative working capital of all zombie companies increased by 31.6% from -$2.15 billion (2015) to -$2.83 billion (2016).
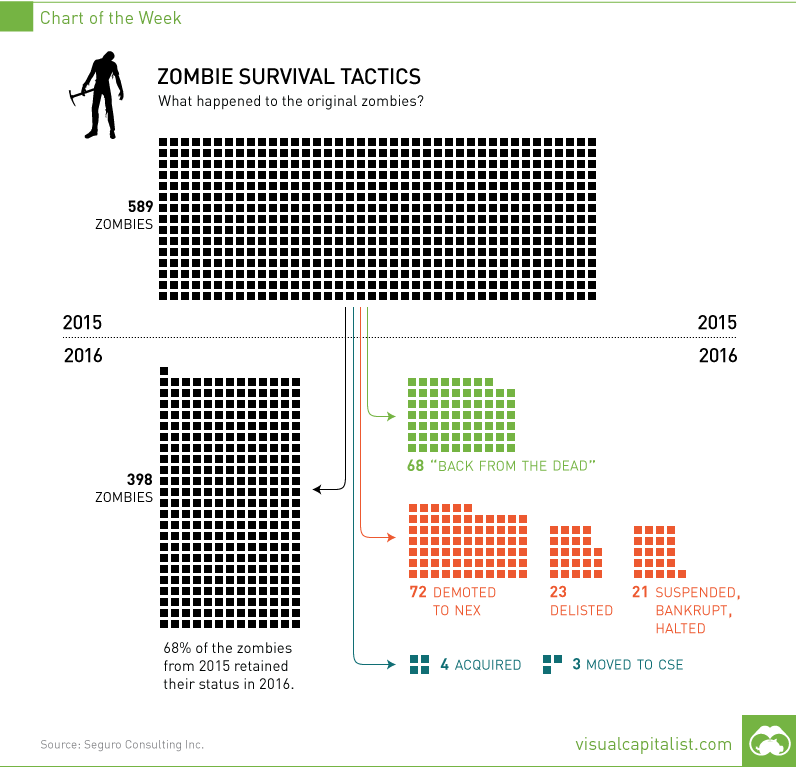
Of the original 589 zombies, 398 (68%) stayed as zombies the following year, and were counted towards 2016’s total. Mr. Simon provided us with some additional stats on the companies carried forward:
- 51% of the zombies have share prices of $0.025 or less.
- Only 13 zombies had $1,000,000 or more of liquidity in the last quarter.
- Meanwhile, an astonishing 68% of zombies traded with less than $50,000 of liquidity last quarter.
- 55% of zombies have market capitalizations of less than $1 million.
In other words, these zombies don’t eat brains for breakfast. Instead, they munch on capital from private placements until no one is willing to feed them.
So why do they continue to exist?
More Zombies, More Problems
From the perspective of the zombie management teams, it makes sense why they still roam the streets in search of capital or a stroke of luck. Just read this post by an anonymous CEO of a zombie company. To sum up: they continue to exist because of fiduciary duty to their shareholders.
However, it gets tougher to explain their existence from other angles.
How does the exchange justify keeping them around? Mr. Simon has been poking at this with a stick to try and get an answer. After all, retail investors have a tough enough time as it is, even without 52% of the total selection of companies being extreme long shots.
Here’s hoping that normalizing commodity prices in gold, silver, zinc, and other metals will help spur mergers and acquisitions in the sector. Perhaps today’s zombies can have their assets “brought to life” on the balance sheets of healthier companies.
Looking for sources?


Lithium
Ranked: The Top 10 EV Battery Manufacturers in 2023
Asia dominates this ranking of the world’s largest EV battery manufacturers in 2023.


The Top 10 EV Battery Manufacturers in 2023
This was originally posted on our Voronoi app. Download the app for free on iOS or Android and discover incredible data-driven charts from a variety of trusted sources.
Despite efforts from the U.S. and EU to secure local domestic supply, all major EV battery manufacturers remain based in Asia.
In this graphic we rank the top 10 EV battery manufacturers by total battery deployment (measured in megawatt-hours) in 2023. The data is from EV Volumes.
Chinese Dominance
Contemporary Amperex Technology Co. Limited (CATL) has swiftly risen in less than a decade to claim the title of the largest global battery group.
The Chinese company now has a 34% share of the market and supplies batteries to a range of made-in-China vehicles, including the Tesla Model Y, SAIC’s MG4/Mulan, and various Li Auto models.
| Company | Country | 2023 Production (megawatt-hour) | Share of Total Production |
|---|---|---|---|
| CATL | 🇨🇳 China | 242,700 | 34% |
| BYD | 🇨🇳 China | 115,917 | 16% |
| LG Energy Solution | 🇰🇷 Korea | 108,487 | 15% |
| Panasonic | 🇯🇵 Japan | 56,560 | 8% |
| SK On | 🇰🇷 Korea | 40,711 | 6% |
| Samsung SDI | 🇰🇷 Korea | 35,703 | 5% |
| CALB | 🇨🇳 China | 23,493 | 3% |
| Farasis Energy | 🇨🇳 China | 16,527 | 2% |
| Envision AESC | 🇨🇳 China | 8,342 | 1% |
| Sunwoda | 🇨🇳 China | 6,979 | 1% |
| Other | - | 56,040 | 8% |
In 2023, BYD surpassed LG Energy Solution to claim second place. This was driven by demand from its own models and growth in third-party deals, including providing batteries for the made-in-Germany Tesla Model Y, Toyota bZ3, Changan UNI-V, Venucia V-Online, as well as several Haval and FAW models.
The top three battery makers (CATL, BYD, LG) collectively account for two-thirds (66%) of total battery deployment.
Once a leader in the EV battery business, Panasonic now holds the fourth position with an 8% market share, down from 9% last year. With its main client, Tesla, now sourcing batteries from multiple suppliers, the Japanese battery maker seems to be losing its competitive edge in the industry.
Overall, the global EV battery market size is projected to grow from $49 billion in 2022 to $98 billion by 2029, according to Fortune Business Insights.

-

 Markets1 week ago
U.S. Debt Interest Payments Reach $1 Trillion
-

 Business2 weeks ago
Charted: Big Four Market Share by S&P 500 Audits
-

 Real Estate2 weeks ago
Ranked: The Most Valuable Housing Markets in America
-

 Money2 weeks ago
Which States Have the Highest Minimum Wage in America?
-

 AI2 weeks ago
Ranked: Semiconductor Companies by Industry Revenue Share
-

 Markets2 weeks ago
Ranked: The World’s Top Flight Routes, by Revenue
-

 Demographics2 weeks ago
Population Projections: The World’s 6 Largest Countries in 2075
-

 Markets2 weeks ago
The Top 10 States by Real GDP Growth in 2023