Mining
Commodities: Gold and Zinc Crush it in Q1, Energy Gets Smoked

Commodities: Gold and Zinc Crush it in Q1, Energy Gets Smoked
The start of 2016 has been a roller coaster for investors.
Global markets had their worst ever start in the first trading days of the year, with the S&P 500 eventually shedding 10.5% by early February. Stocks have rebounded since then, but tension is still in the air with record longs on the VIX Volatility Index.
Precious Metals
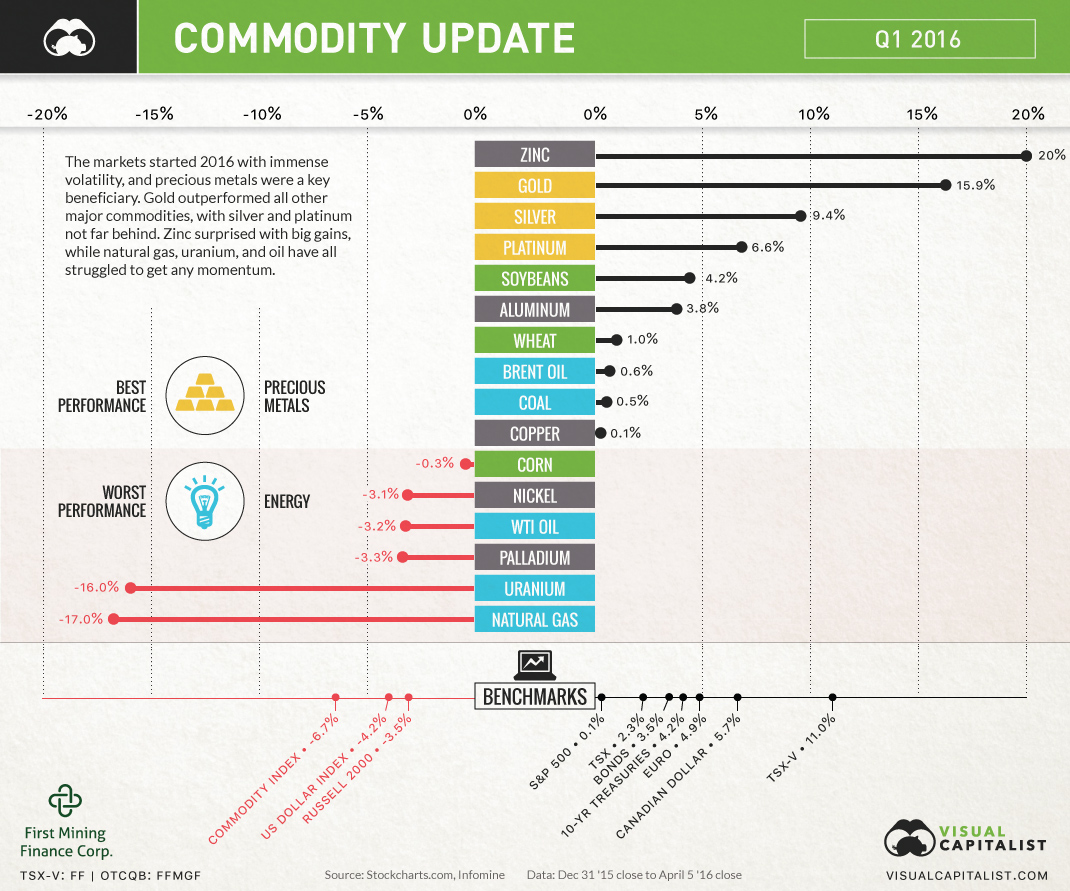
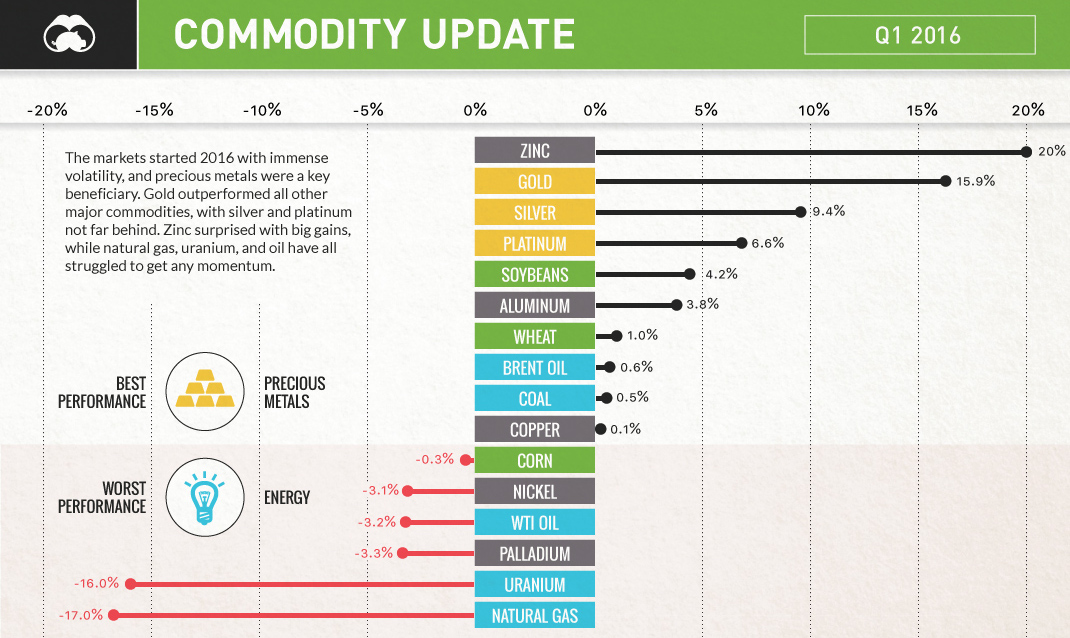
For this reason, among many others, investors piled into precious metals in Q1 of 2016. Gold finished up an impressive 15.9%, buoyed by record buying in gold ETFs. Meanwhile, silver and platinum, which are considered precious metals with more industrial uses, were also up in Q1 to a lesser extent: 9.4% and 6.6% respectively.
Base Metals
Base metals were all over the map in the first few months of the year. Zinc shot up a surprising 20%, though it has been overdue for a bounce back since hitting five-year lows in 2015. Nickel and copper, however, did not perform as admirably. Nickel was in negative territory (-3.1%) and copper ultimately ended up flat, despite a large rally in February and early-March.
Energy
The energy sector had no real winners, with WTI crude, natural gas, and uranium all ending up in the red. Natural gas was the worst of these with a steep -17.0% drop as it continues to eye multi-decade lows. Some analysts expect more downward pressure on natural gas now that the quantity of gas in storage is 34.2% higher than the five-year average.
Food
The world’s key agricultural commodities were a mixed bag in terms of performance. Soybeans jumped 4.2% in value, but wheat (1.0%) and corn (-0.3%) only had subtle changes in prices.
With many looming questions for Q2, we’re sure that our next quarterly update will be just as eventful. Concerns around a potential Brexit, negative interest rates, stagnating manufacturing, and a potential U.S. rate hike could make for a particularly interesting time period.
Chart presented by: First Mining Finance Corp.
Lithium
Ranked: The Top 10 EV Battery Manufacturers in 2023
Asia dominates this ranking of the world’s largest EV battery manufacturers in 2023.

The Top 10 EV Battery Manufacturers in 2023
This was originally posted on our Voronoi app. Download the app for free on iOS or Android and discover incredible data-driven charts from a variety of trusted sources.
Despite efforts from the U.S. and EU to secure local domestic supply, all major EV battery manufacturers remain based in Asia.
In this graphic we rank the top 10 EV battery manufacturers by total battery deployment (measured in megawatt-hours) in 2023. The data is from EV Volumes.
Chinese Dominance
Contemporary Amperex Technology Co. Limited (CATL) has swiftly risen in less than a decade to claim the title of the largest global battery group.
The Chinese company now has a 34% share of the market and supplies batteries to a range of made-in-China vehicles, including the Tesla Model Y, SAIC’s MG4/Mulan, and various Li Auto models.
| Company | Country | 2023 Production (megawatt-hour) | Share of Total Production |
|---|---|---|---|
| CATL | 🇨🇳 China | 242,700 | 34% |
| BYD | 🇨🇳 China | 115,917 | 16% |
| LG Energy Solution | 🇰🇷 Korea | 108,487 | 15% |
| Panasonic | 🇯🇵 Japan | 56,560 | 8% |
| SK On | 🇰🇷 Korea | 40,711 | 6% |
| Samsung SDI | 🇰🇷 Korea | 35,703 | 5% |
| CALB | 🇨🇳 China | 23,493 | 3% |
| Farasis Energy | 🇨🇳 China | 16,527 | 2% |
| Envision AESC | 🇨🇳 China | 8,342 | 1% |
| Sunwoda | 🇨🇳 China | 6,979 | 1% |
| Other | - | 56,040 | 8% |
In 2023, BYD surpassed LG Energy Solution to claim second place. This was driven by demand from its own models and growth in third-party deals, including providing batteries for the made-in-Germany Tesla Model Y, Toyota bZ3, Changan UNI-V, Venucia V-Online, as well as several Haval and FAW models.
The top three battery makers (CATL, BYD, LG) collectively account for two-thirds (66%) of total battery deployment.
Once a leader in the EV battery business, Panasonic now holds the fourth position with an 8% market share, down from 9% last year. With its main client, Tesla, now sourcing batteries from multiple suppliers, the Japanese battery maker seems to be losing its competitive edge in the industry.
Overall, the global EV battery market size is projected to grow from $49 billion in 2022 to $98 billion by 2029, according to Fortune Business Insights.
-

 Mining1 week ago
Gold vs. S&P 500: Which Has Grown More Over Five Years?
-

 Markets2 weeks ago
Ranked: The Most Valuable Housing Markets in America
-

 Money2 weeks ago
Which States Have the Highest Minimum Wage in America?
-

 AI2 weeks ago
Ranked: Semiconductor Companies by Industry Revenue Share
-

 Markets2 weeks ago
Ranked: The World’s Top Flight Routes, by Revenue
-

 Countries2 weeks ago
Population Projections: The World’s 6 Largest Countries in 2075
-

 Markets2 weeks ago
The Top 10 States by Real GDP Growth in 2023
-

 Demographics2 weeks ago
The Smallest Gender Wage Gaps in OECD Countries


